Features
You can learn more in our roadmap.
Overview
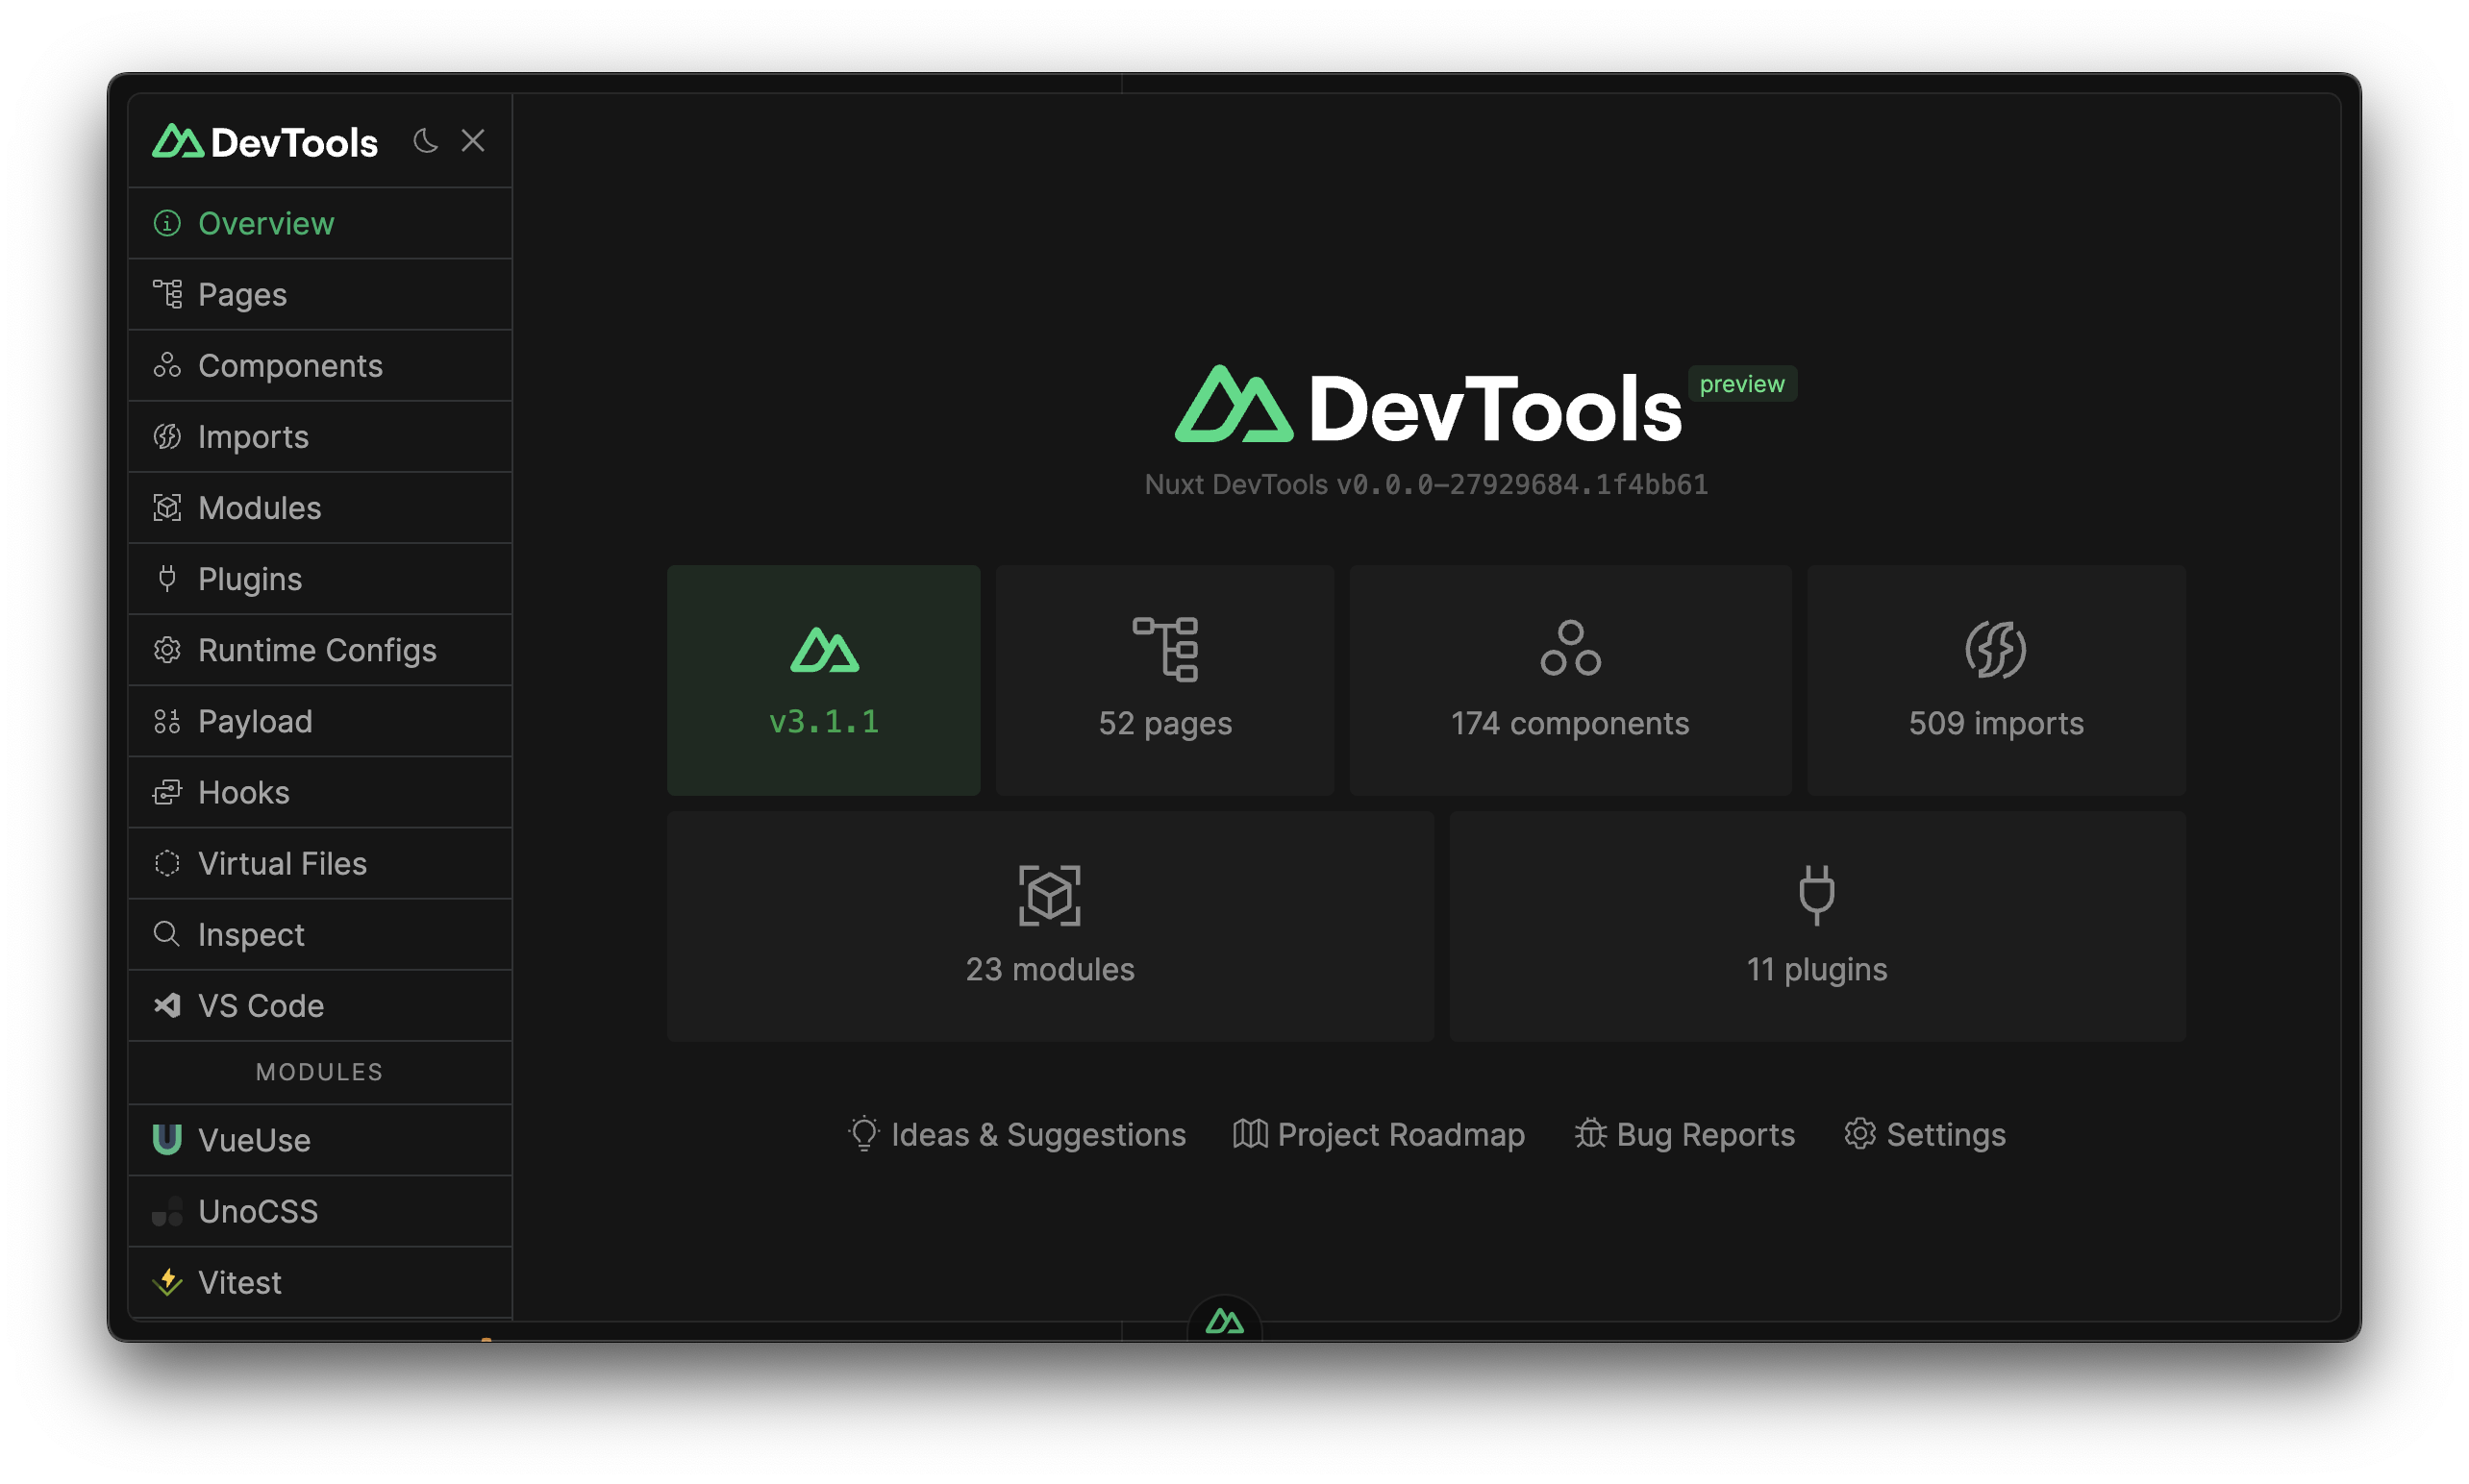
Shows a quick overview of your app, including the Nuxt version (which if it’s not up to date you can easily update it), Vue version, pages, components, imports, modules and plugins that you are using, and your app’s loading time and more!
Pages
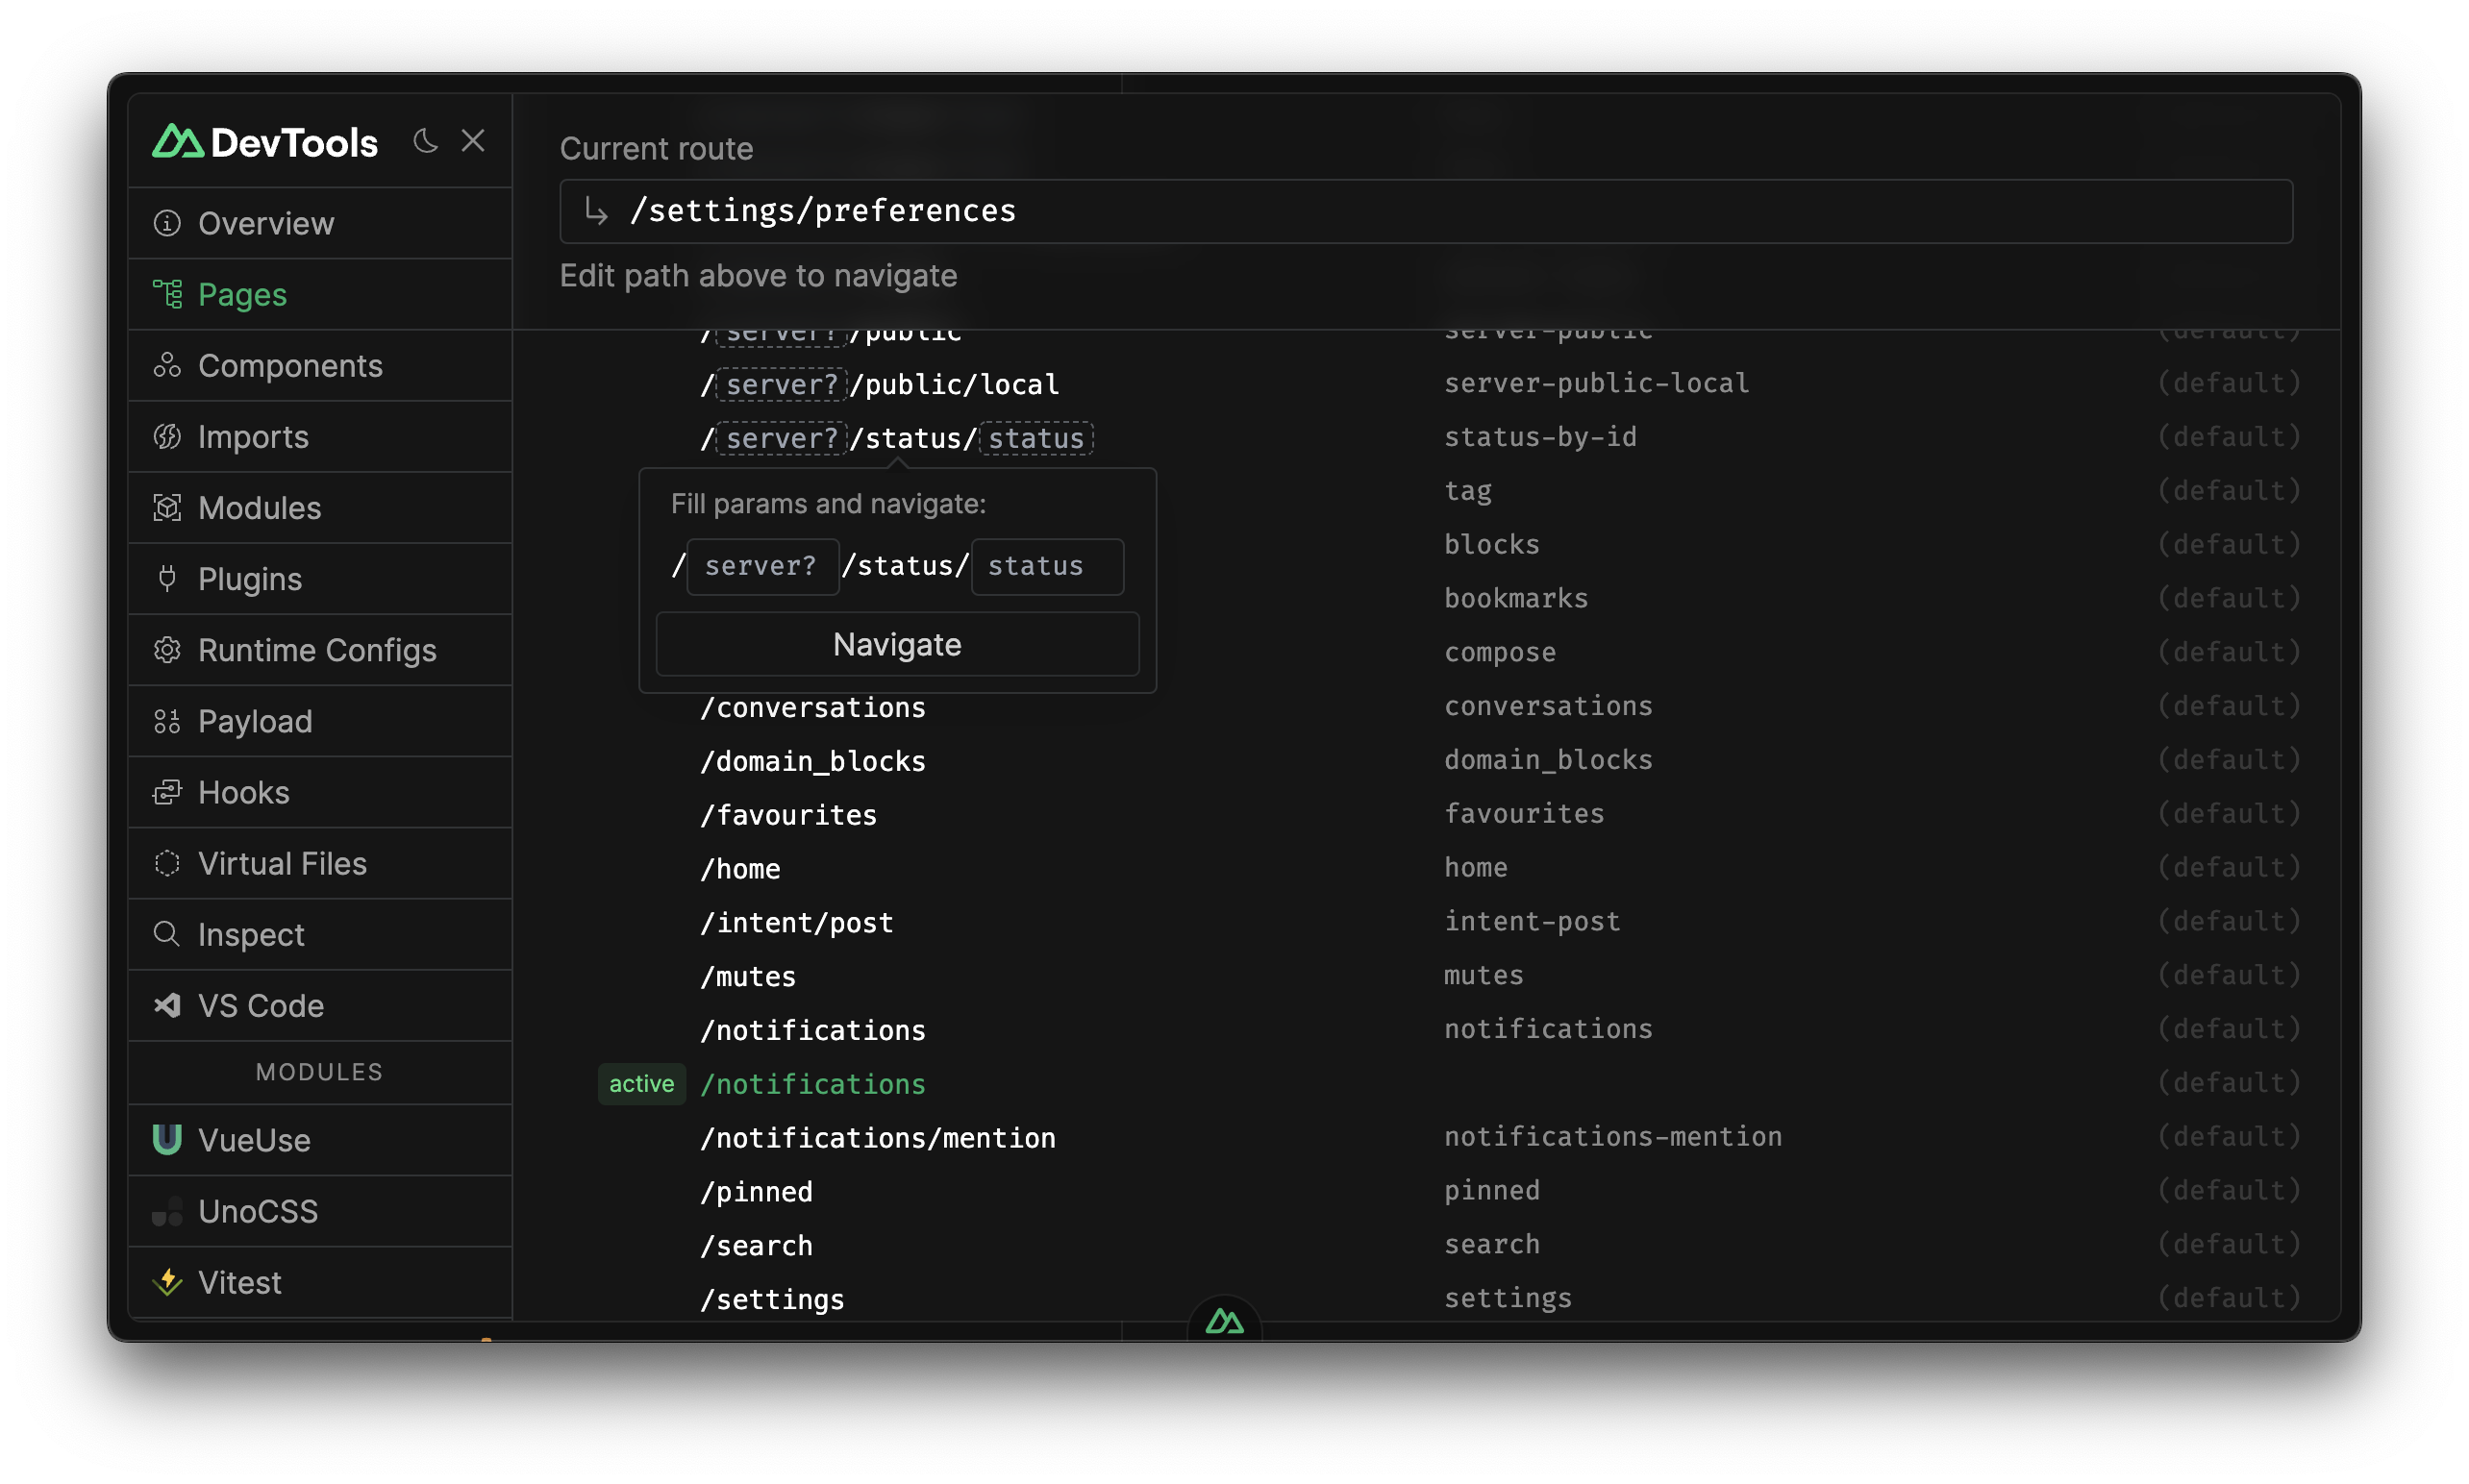
Pages tab shows your current routes with some useful information such as what layout or middleware it has, and provides a quick way to navigate between pages. You can also use the textbox to see how each route is matched.
Components
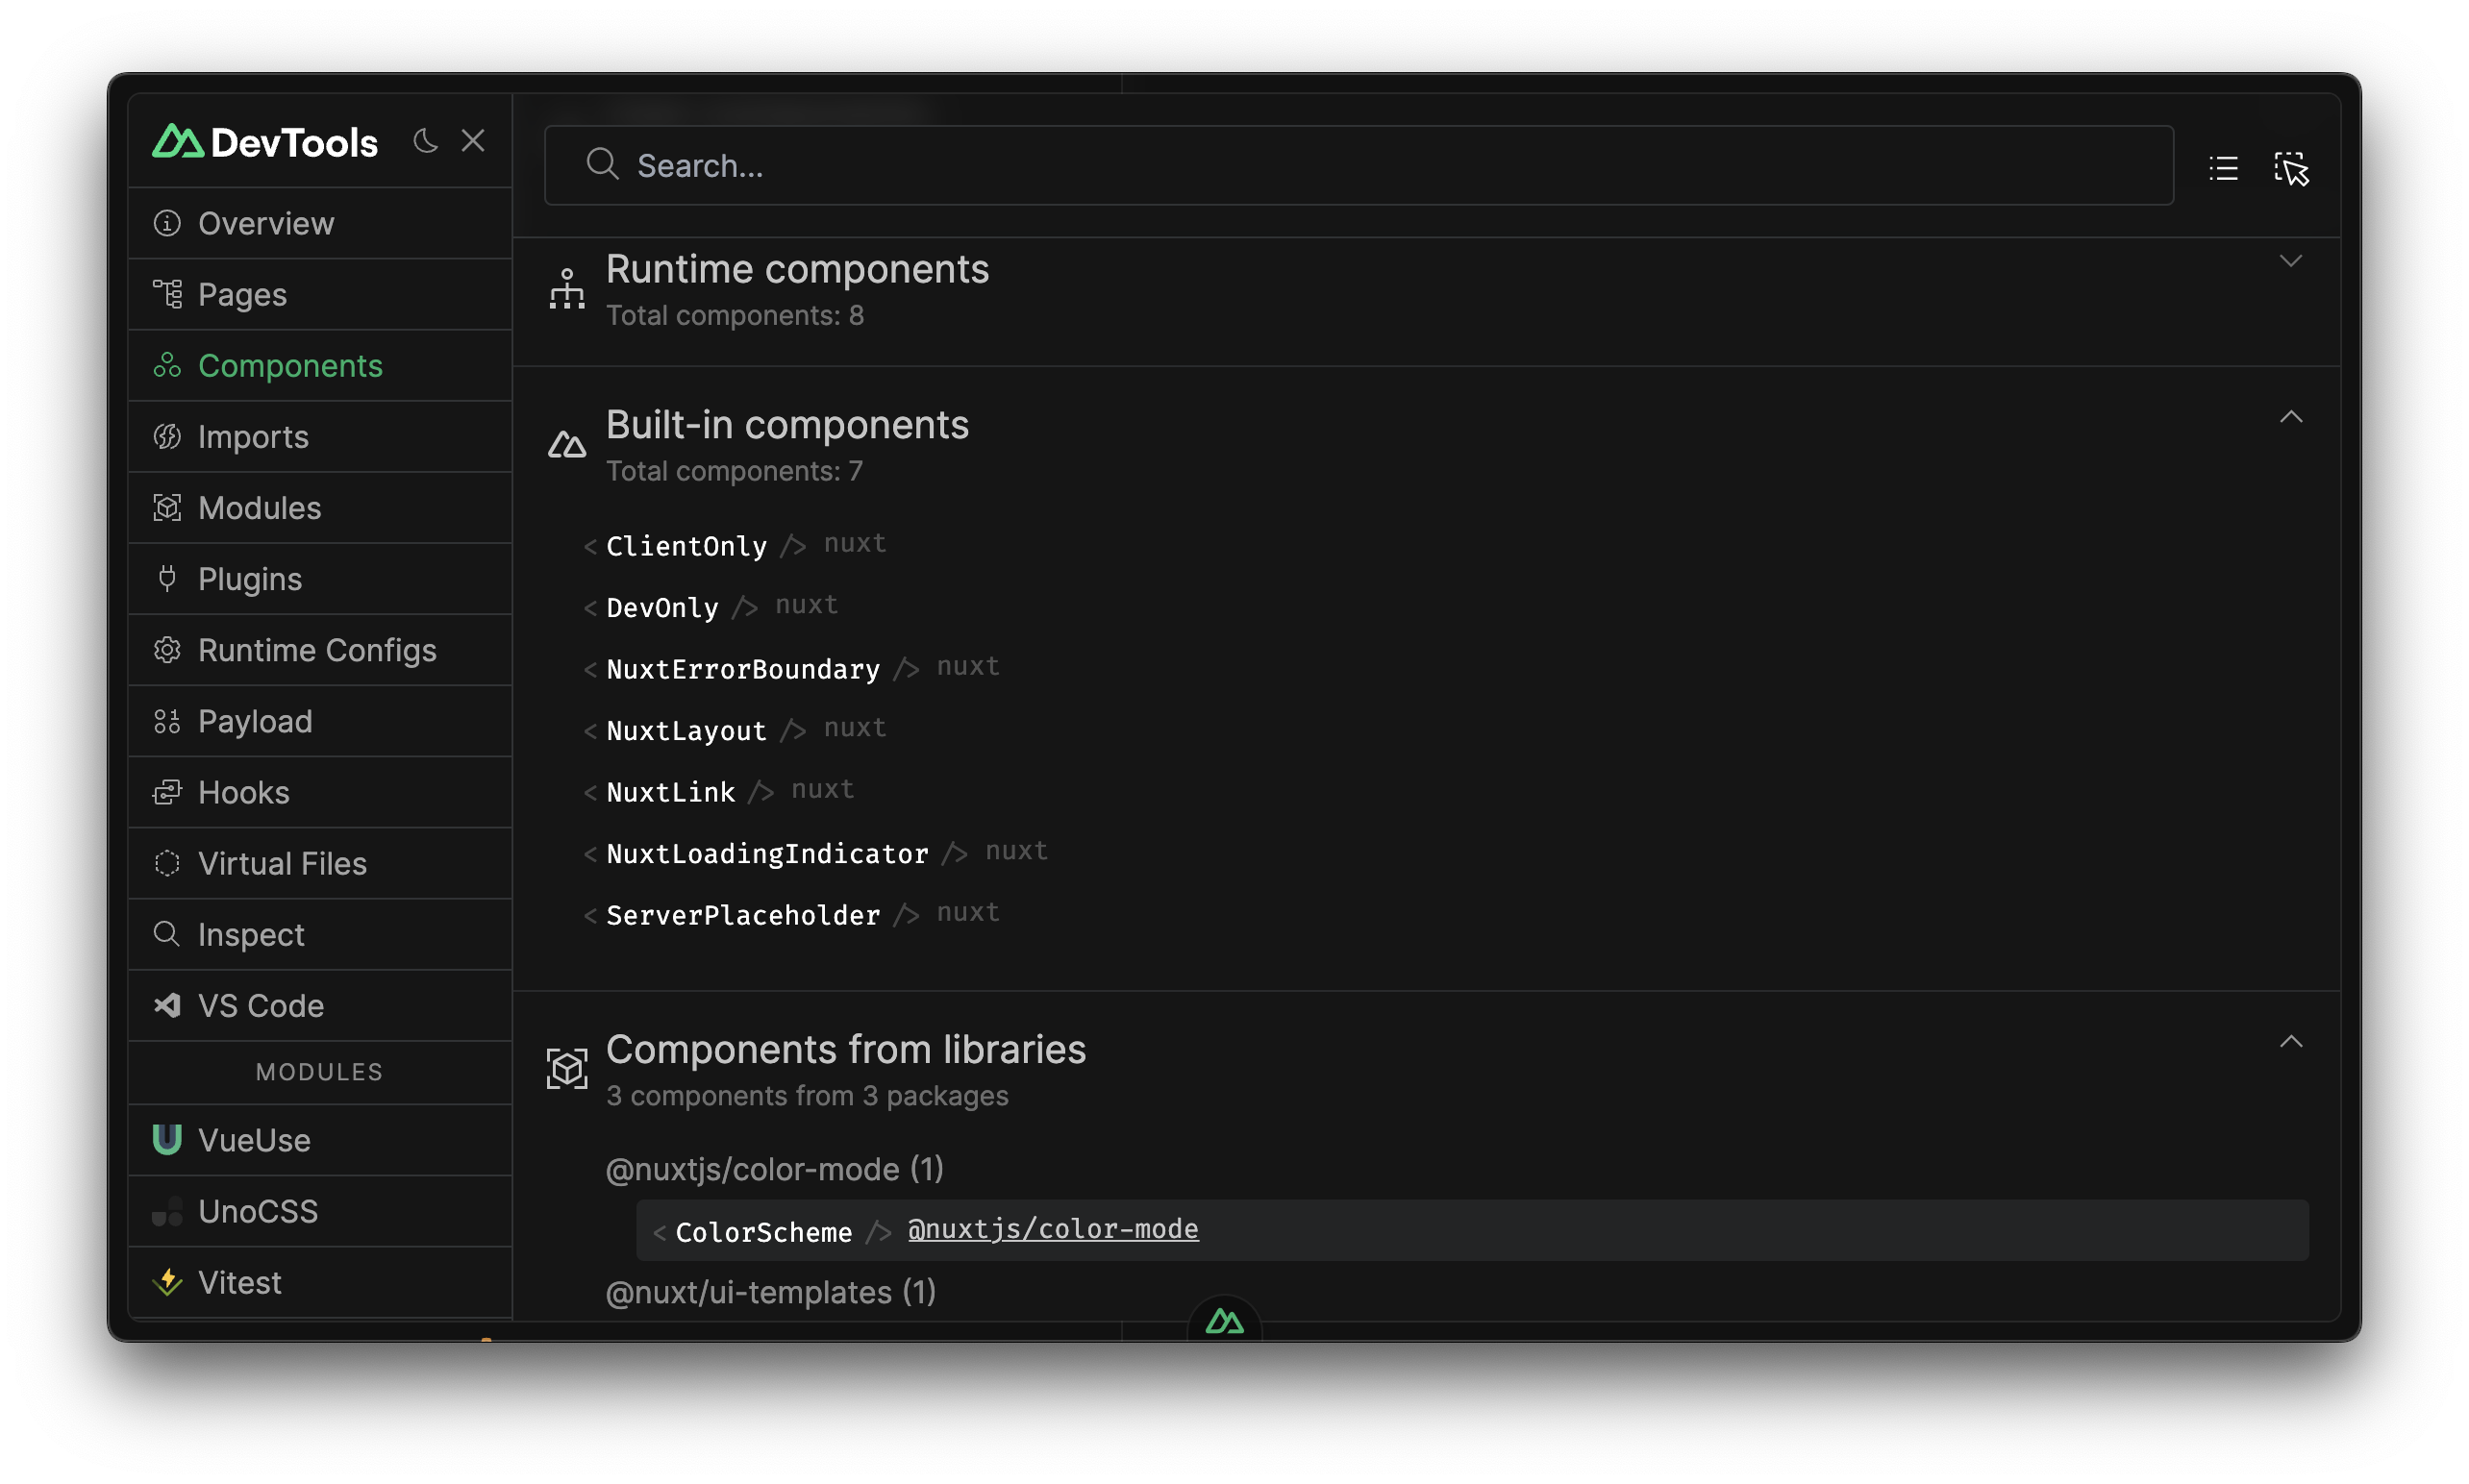
Components tab shows all the components you are using in your app and where they are from. You can also search for them and go to the source code.
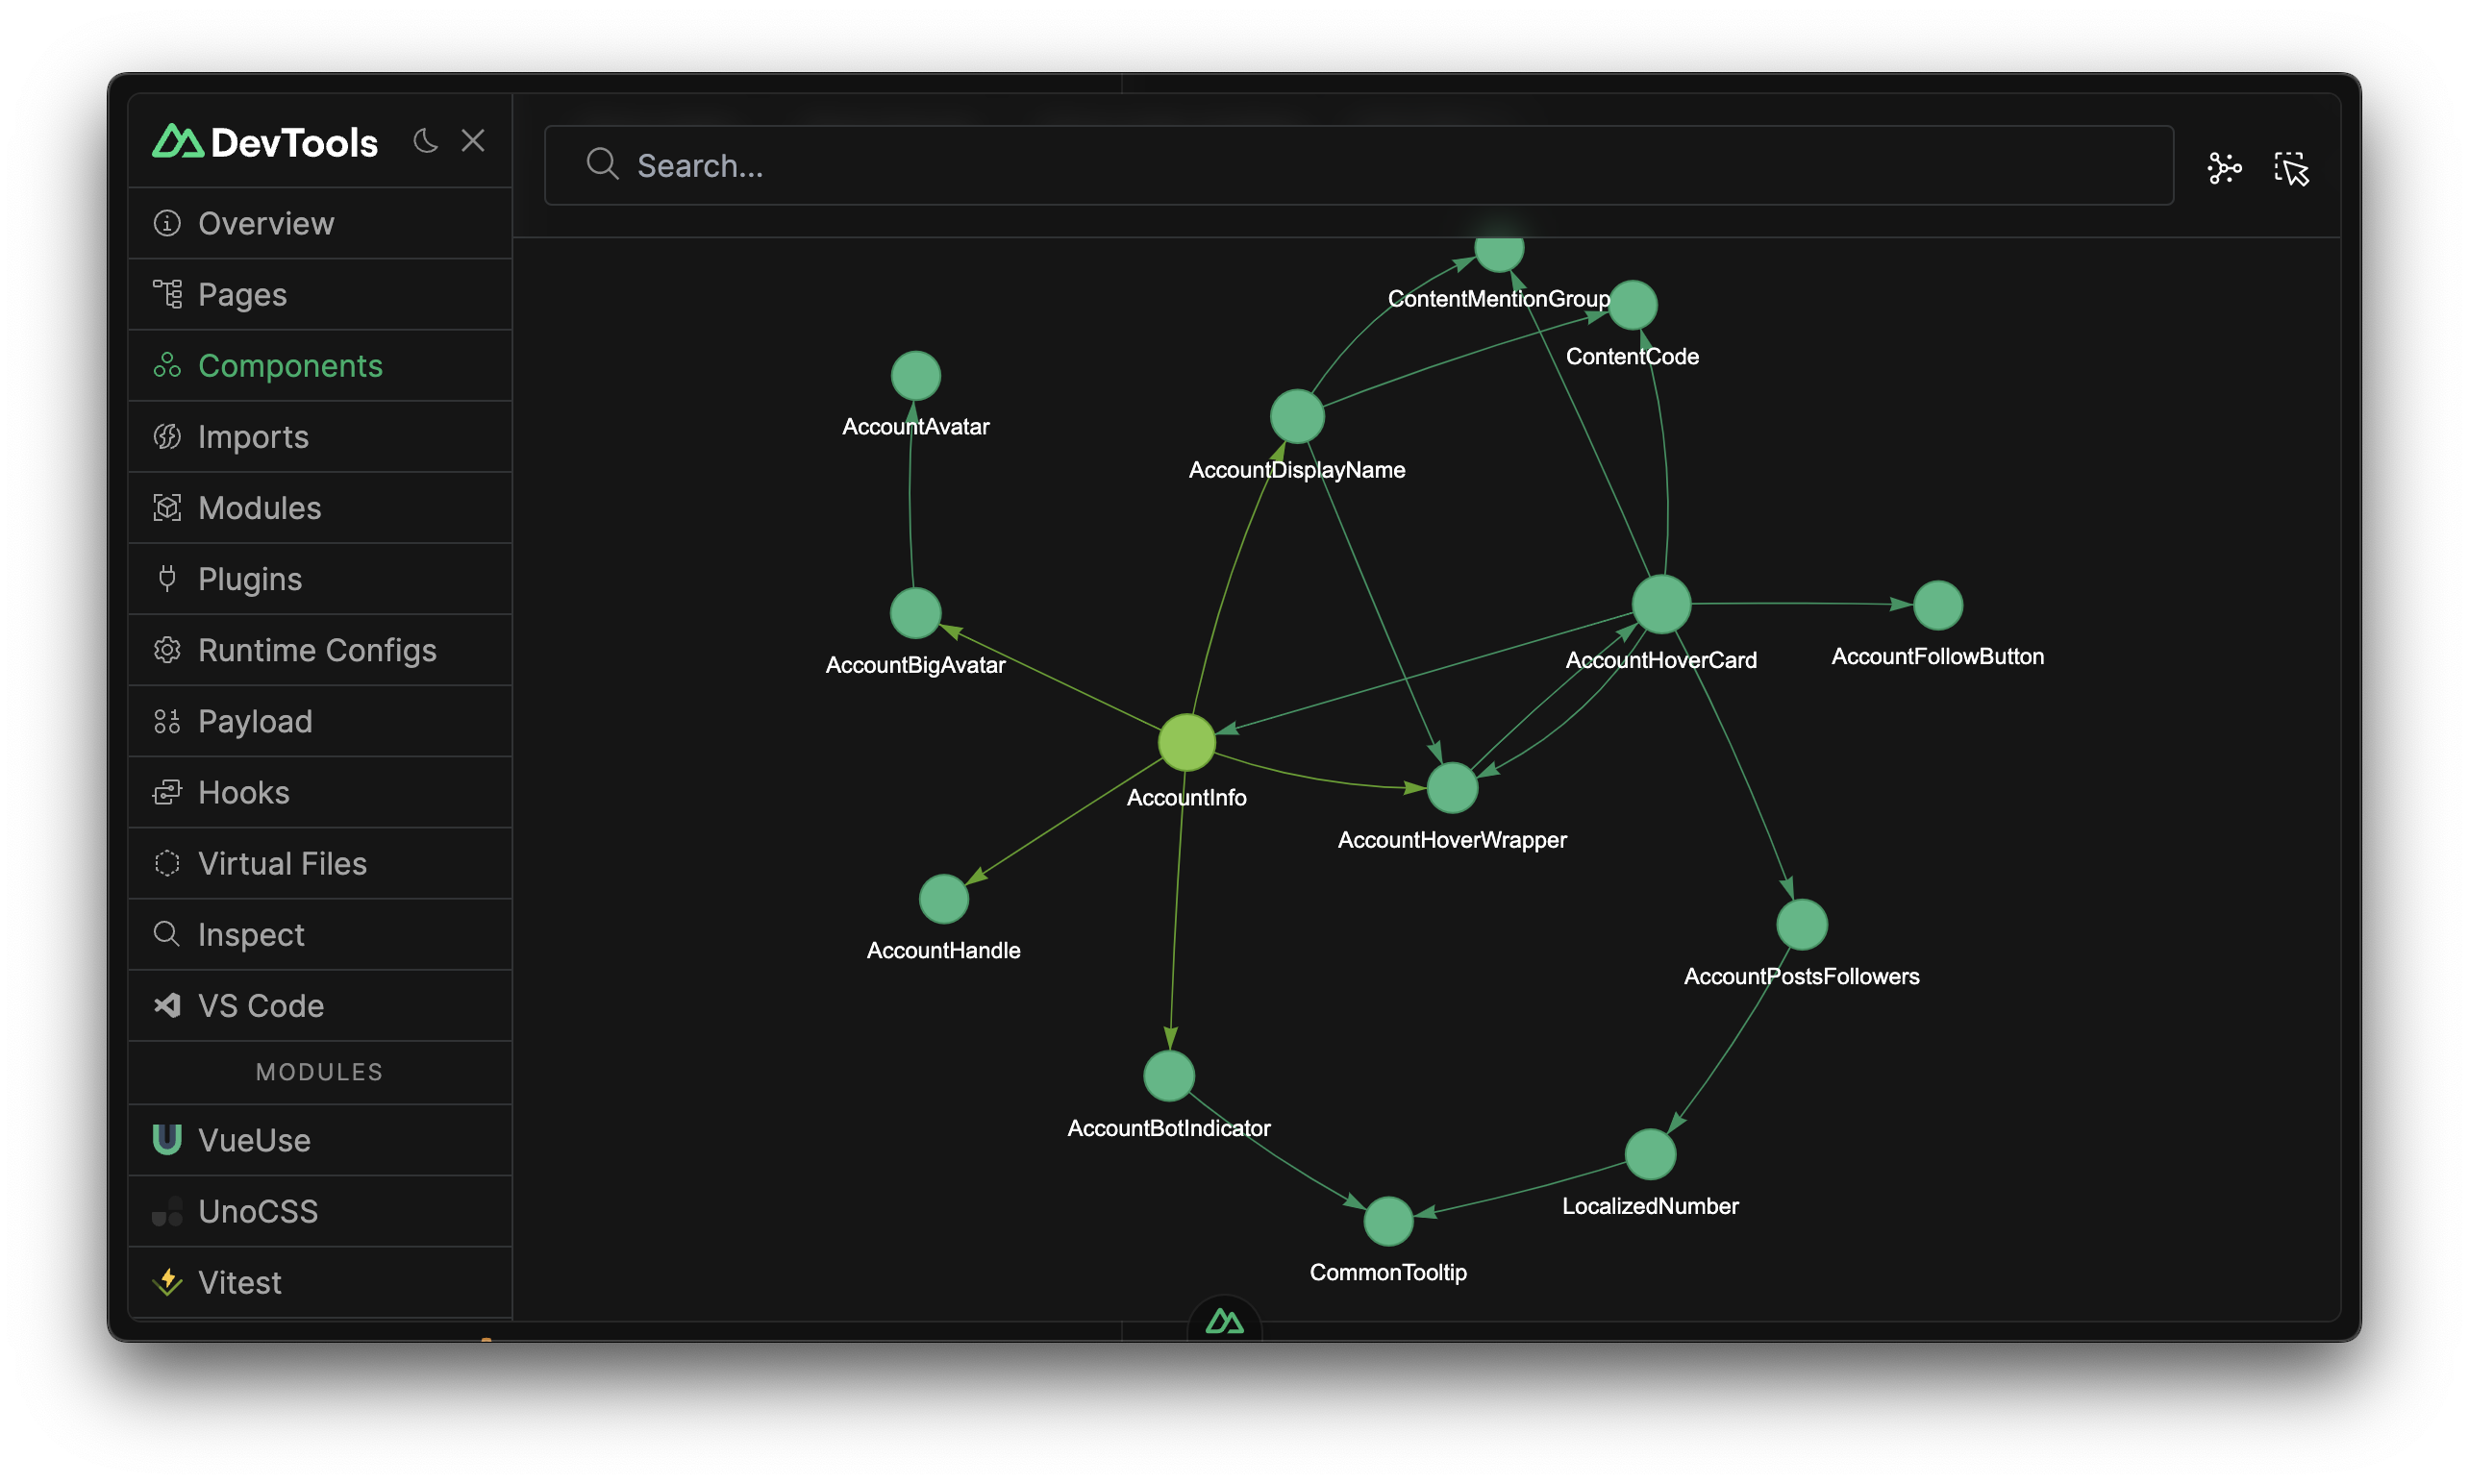
Components tab also has a Graph view which you can toggle. Graph view also shows the relationship between components, and knows the dependencies of each component.
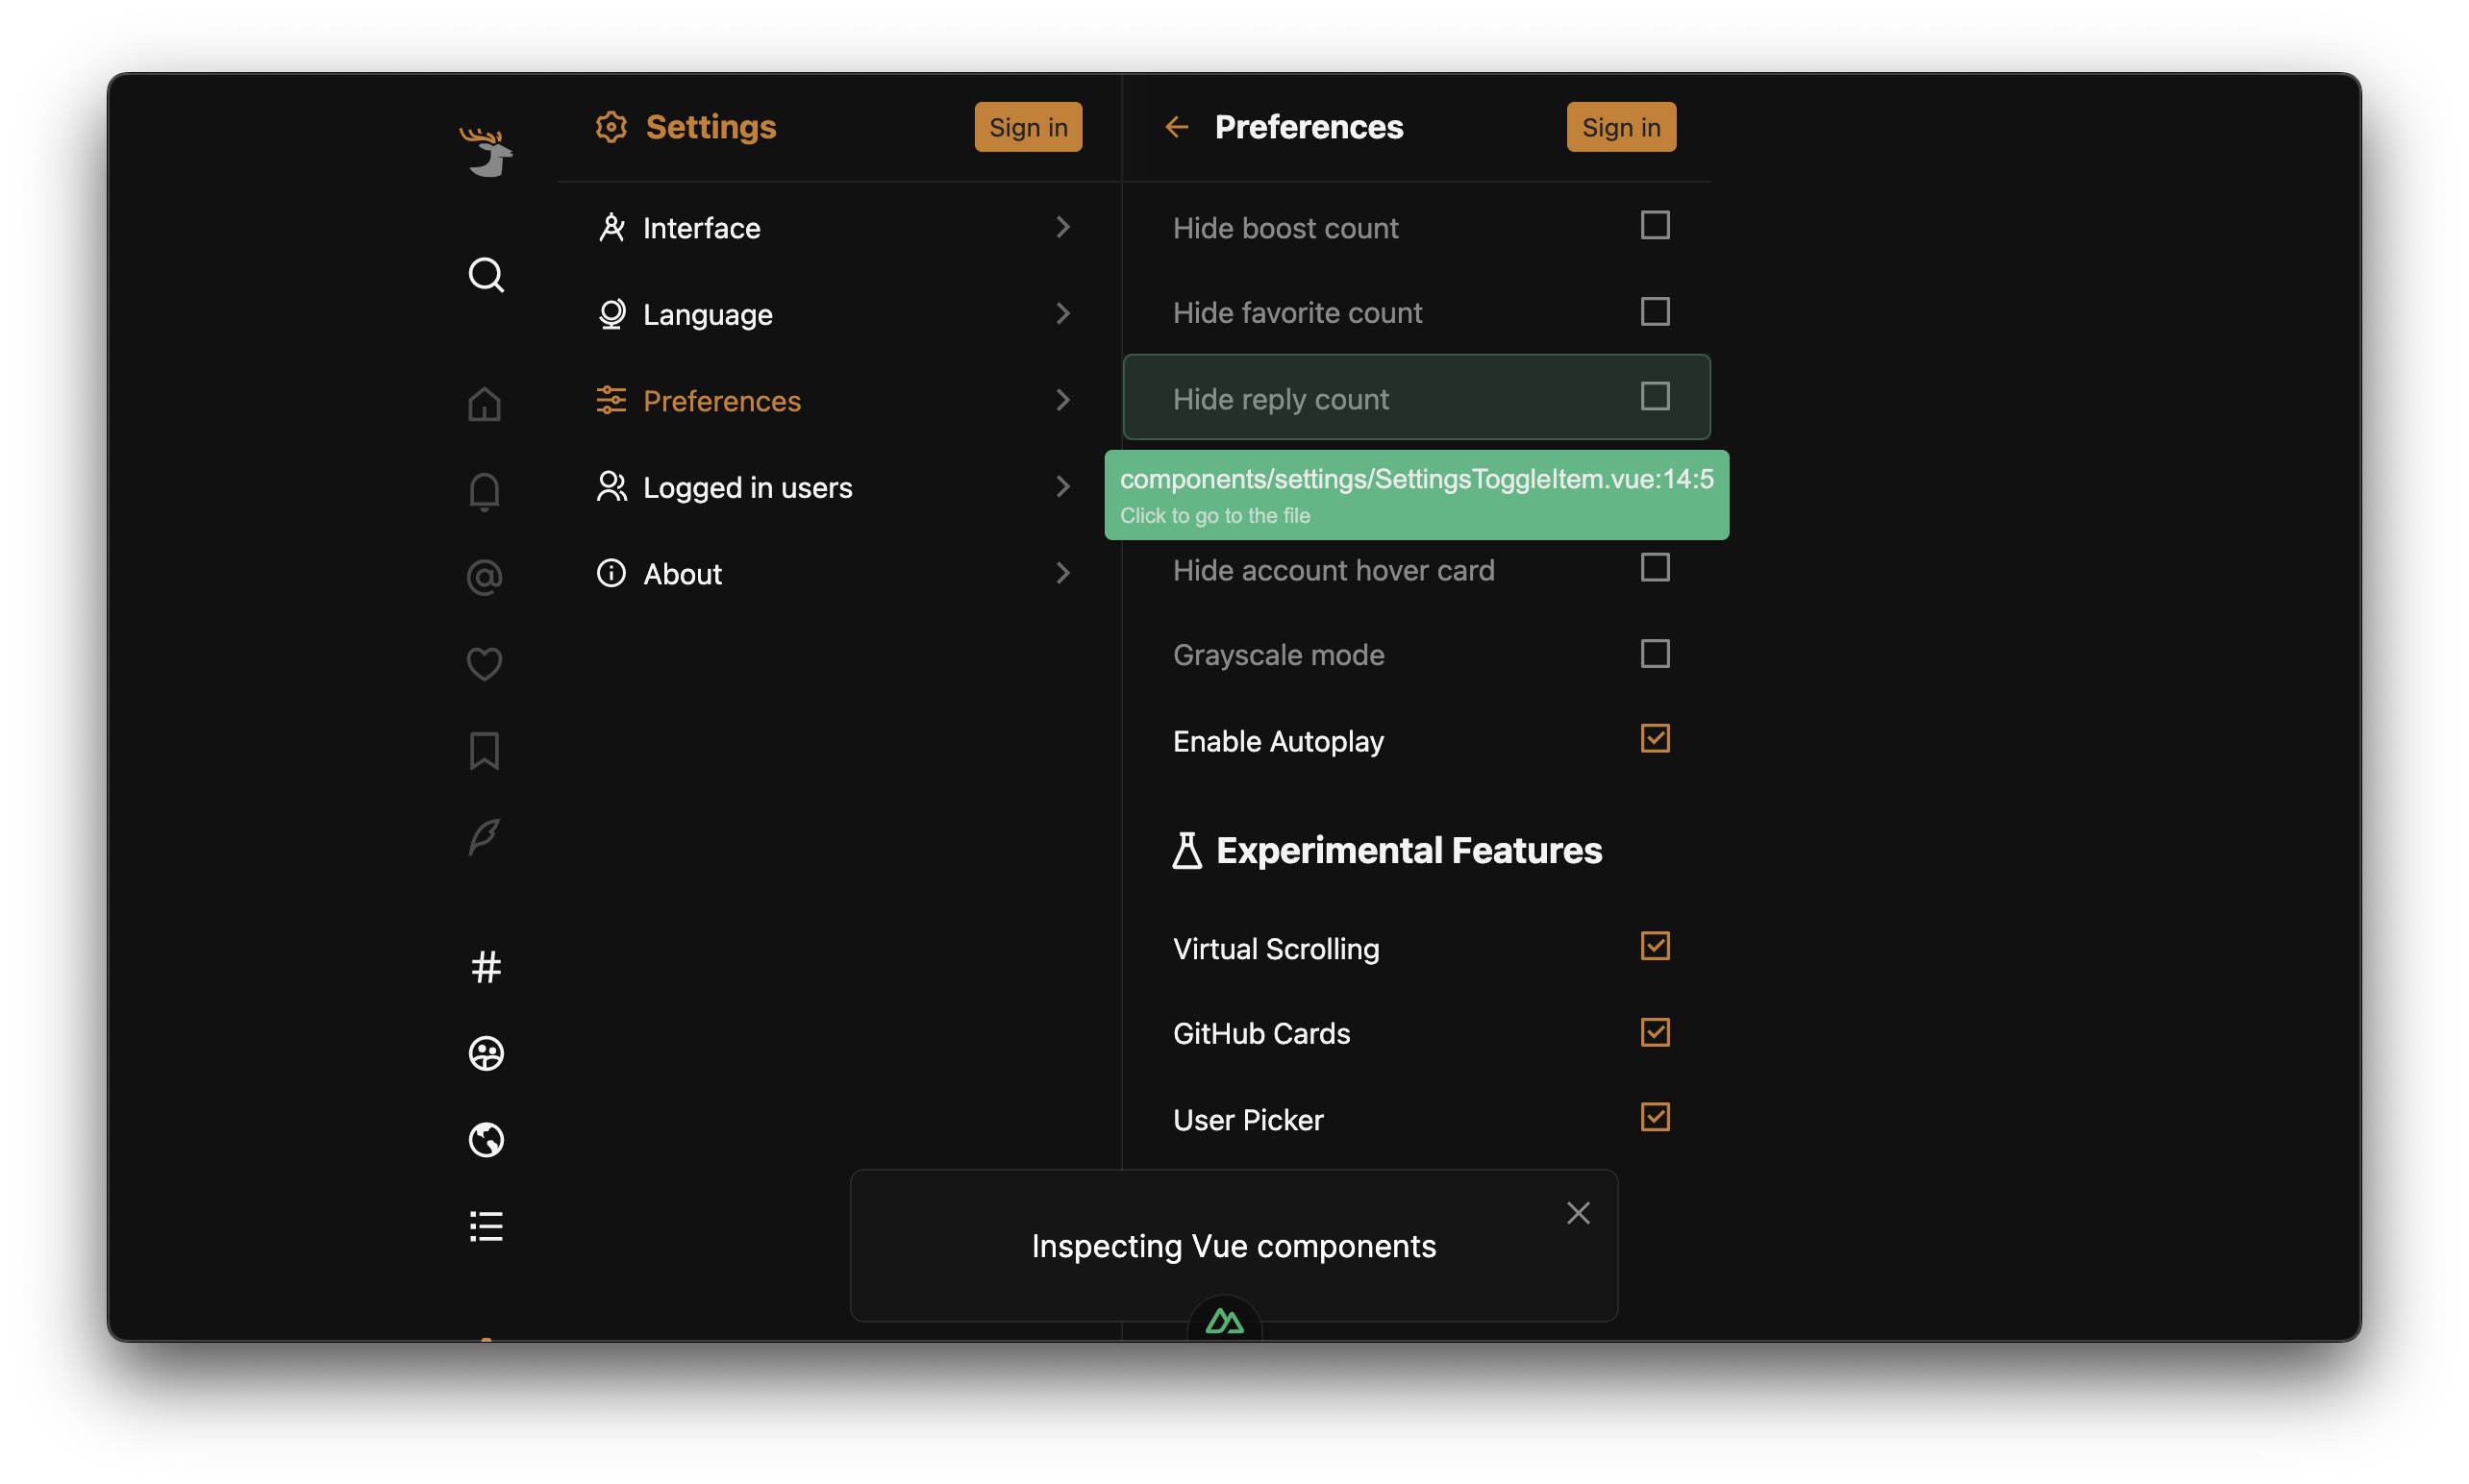
You can also inspect your app's DOM tree and see which component is rendering it. Finding the place to make changes are much easier.
Imports
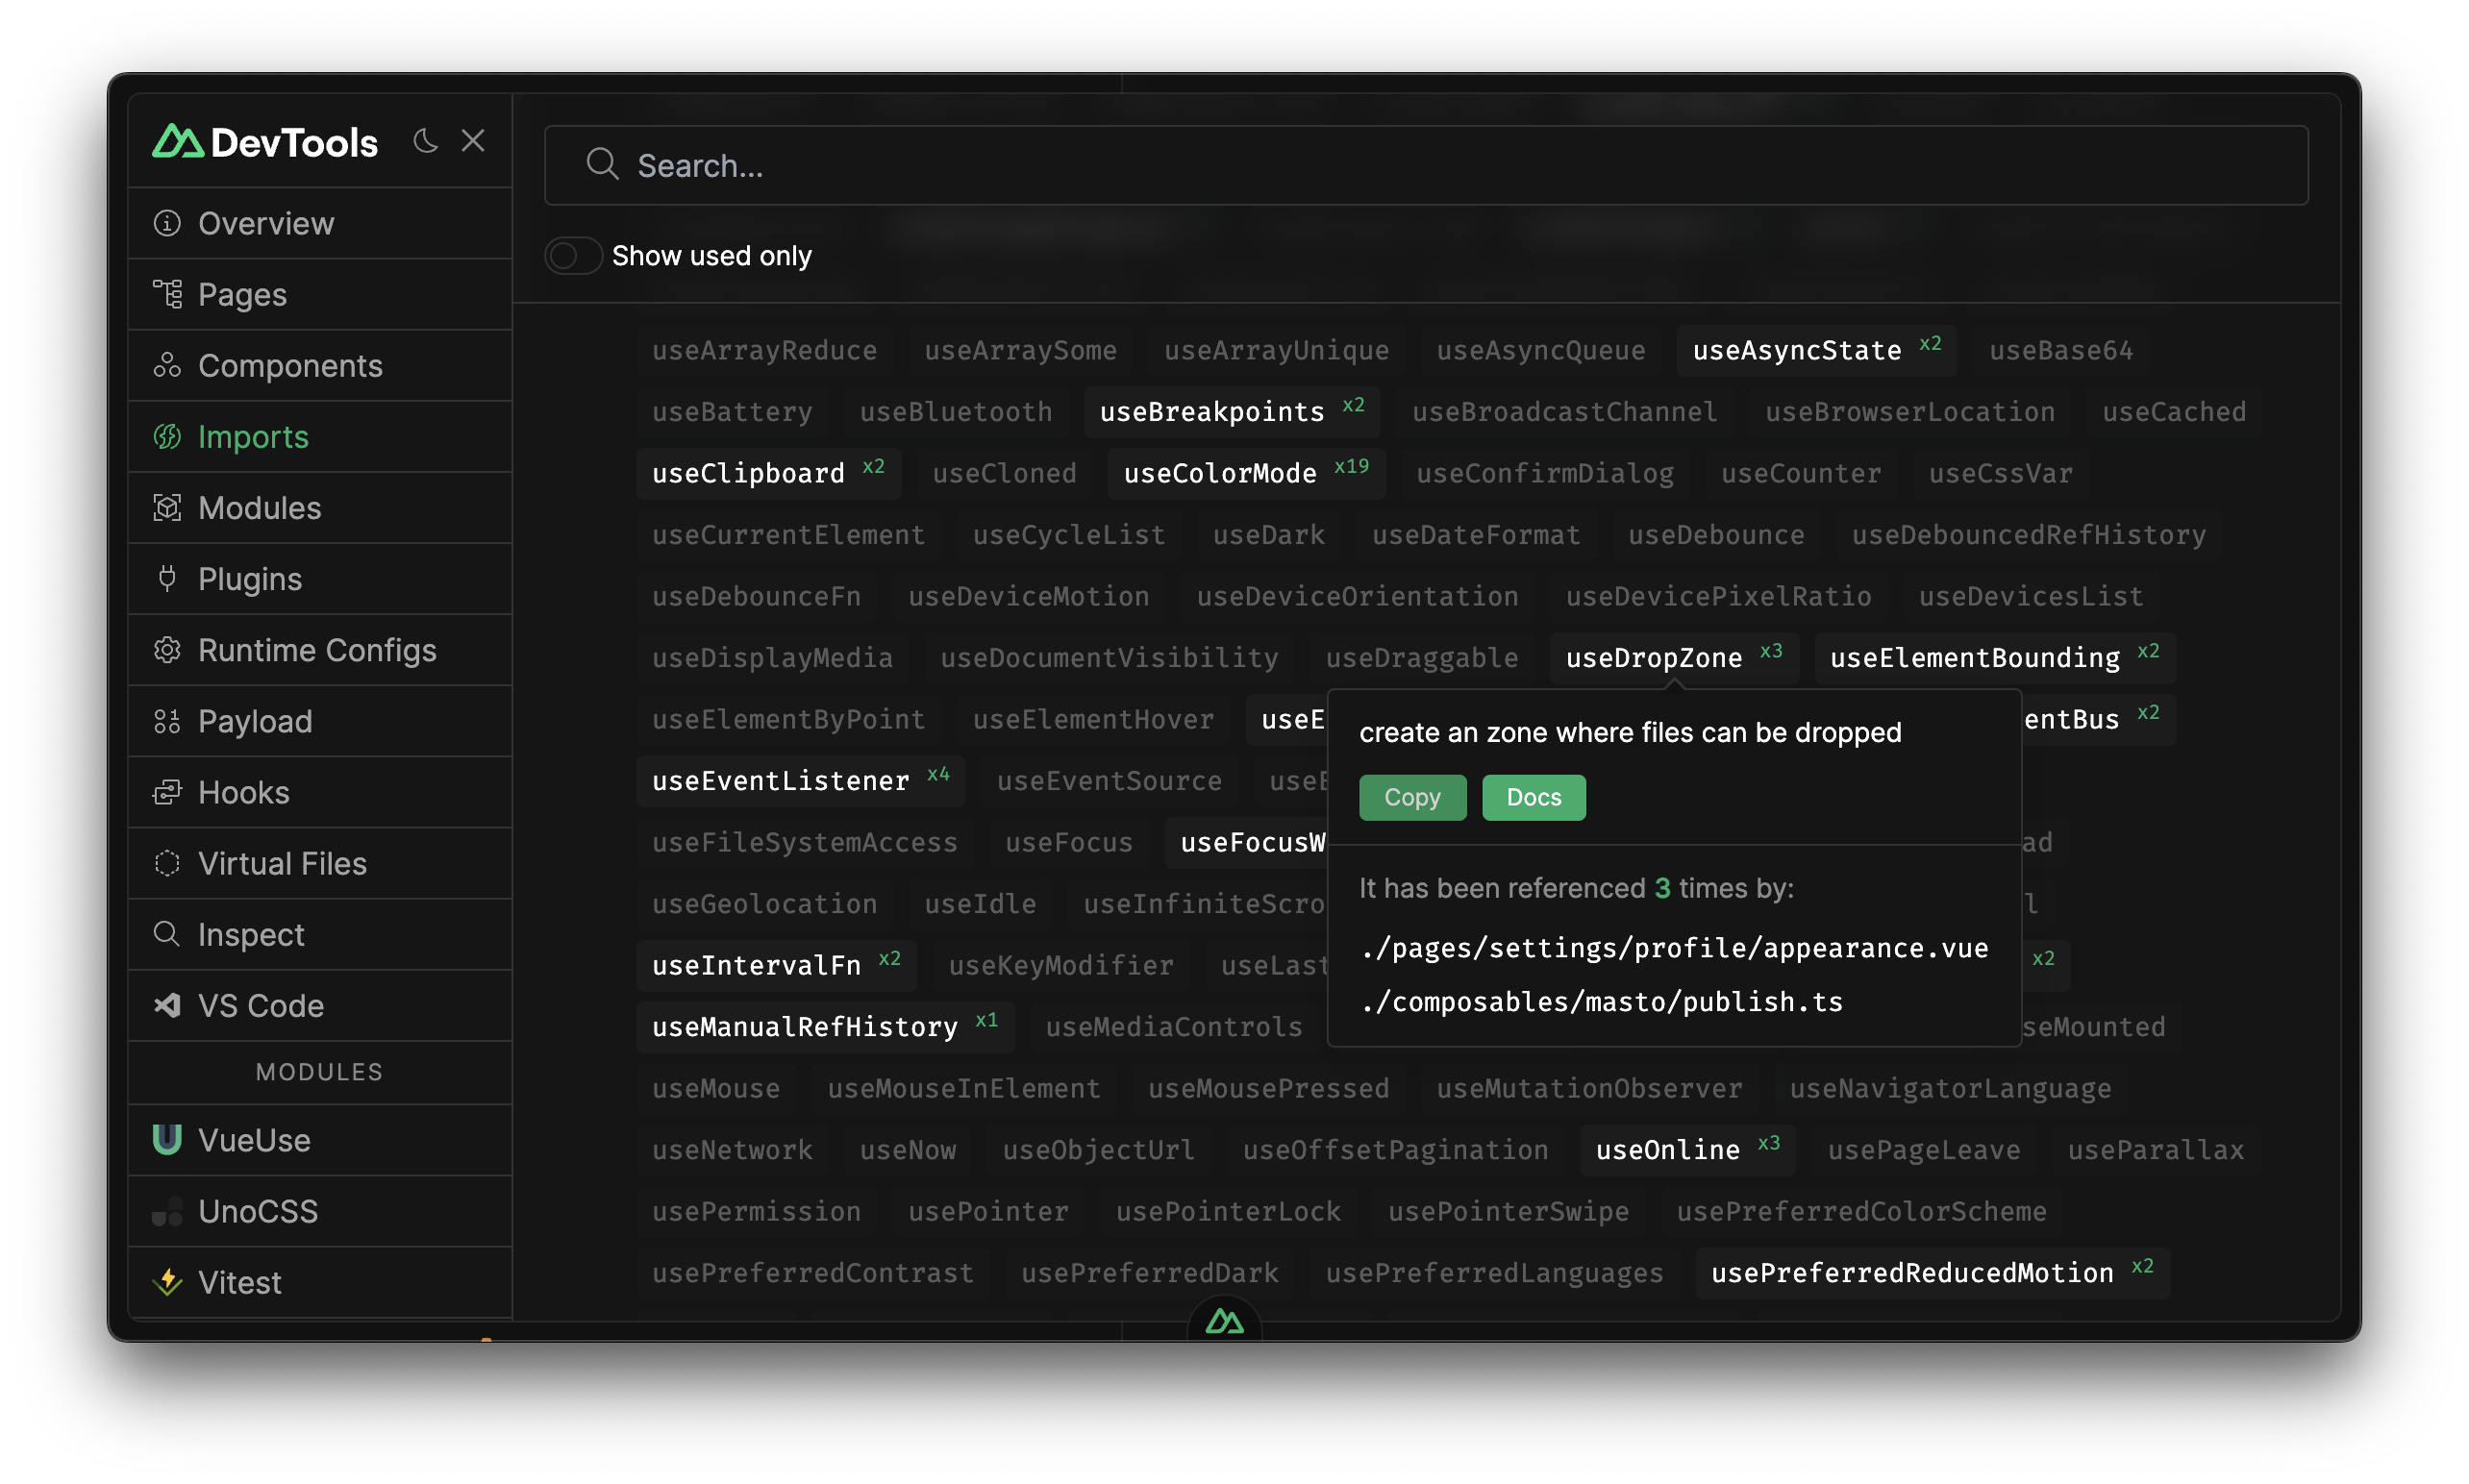
Imports tab shows all the auto-imports registered to Nuxt. You can see which files are importing them, and where they are from. Some entries can also provide short descriptions and documentation links.
Modules
Modules tab shows all the modules you have installed and their information such as the module’s github repository, documentation, version and …
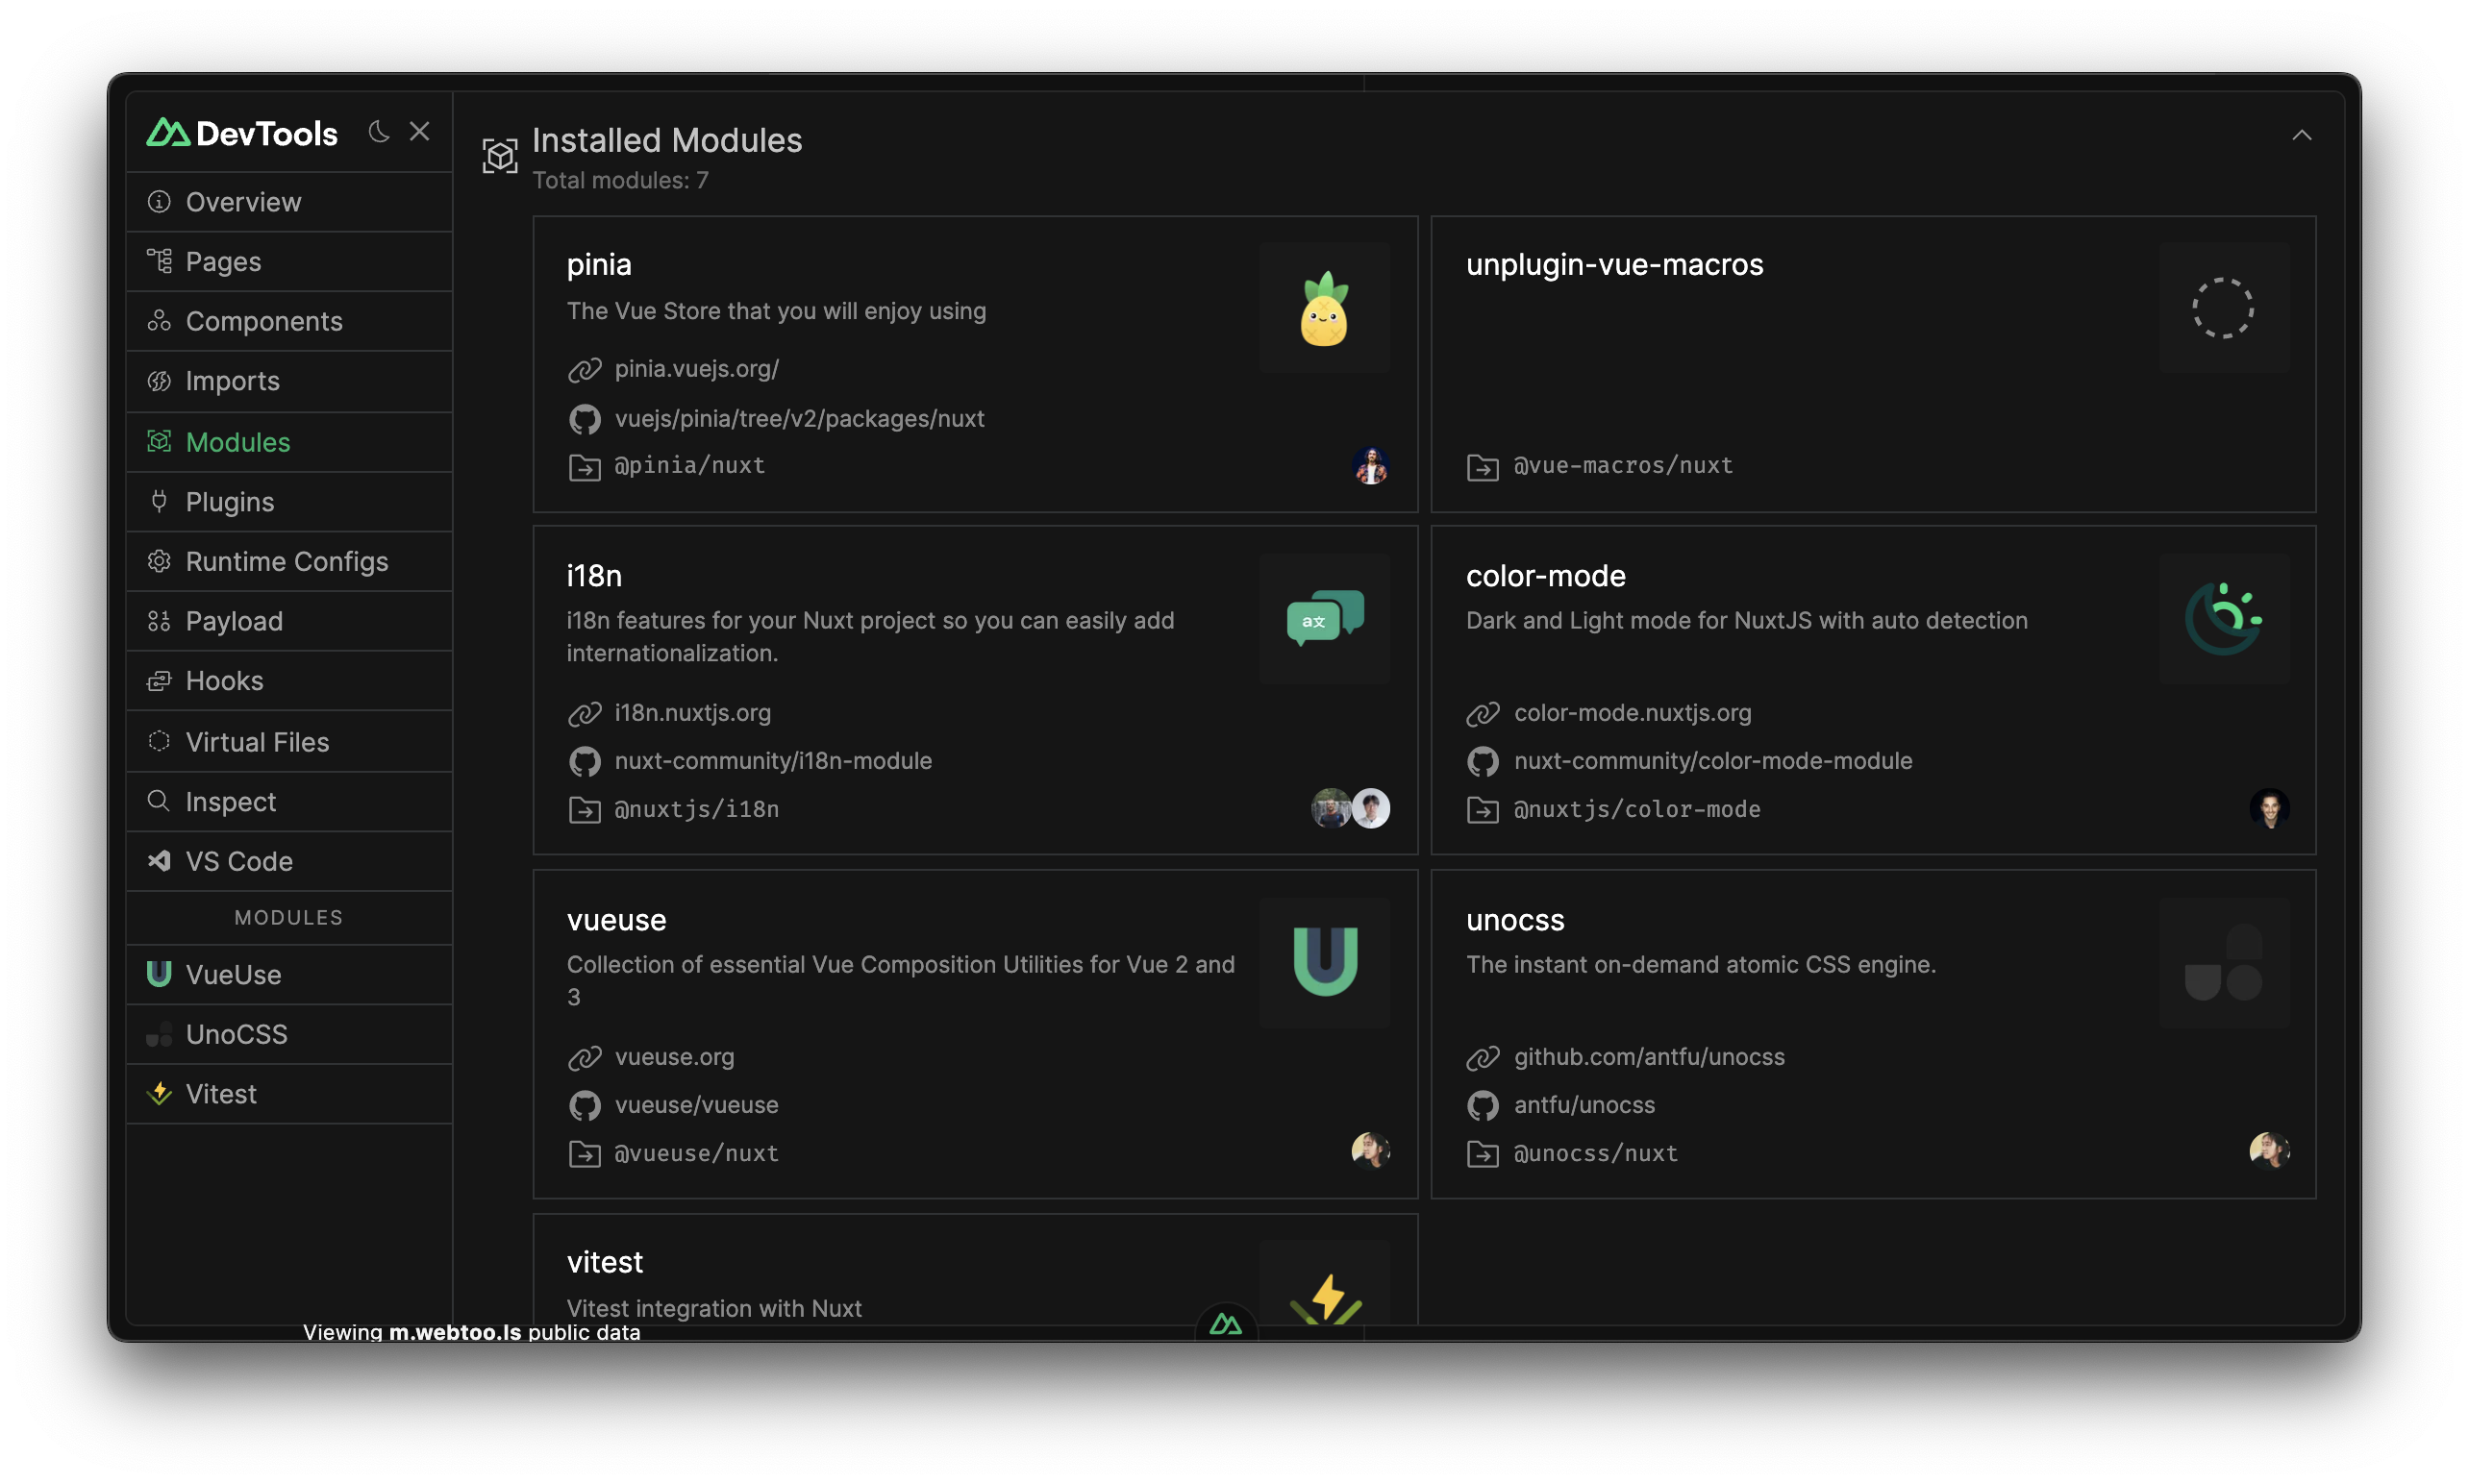
You can install or even remove any Nuxt module with one-click!
Assets
Assets tab shows your files from the Public directory, you can see the information of selected file with some helpful actions.
You can also upload files with Drag & Drop ability
Terminals
Terminals tab shows the active terminal processes.
Runtime Config
Runtime Config tab shows all the runtime config of your project, with the ability to edit them.
Payload
Payloads tab shows all the state and data payloads of your project.
Build Analyze
In the Build Analyze tab, you can run analyze build and see the bundle size of your project. it saves the report so you can compare the bundle size in different builds.
Open Graph
Open Graph tab is to help you with SEO, it shows you a Social Preview Card for twitter, facebook and linkedIn for your page. It also provides missing SEO tags with the ability to copy code snippets.
Plugins
Plugins tab shows all the plugins your project is using, with some information such as plugin's initialization time.
Server Routes
Server Routes tab shows all nitro routes in your project. It provides a playground to send and test your endpoints.
Storage
Storage tab shows all the nitro storage in your project. You can create, edit, and delete files.
Learn more about Nitro Storage
Tasks
Tasks tab shows all nitro tasks in your project. You can pass task payloads, run them, and see the task results.
Learn more about Nitro Tasks
Data Inspector
The Data Inspector lives in the Nuxt group and is an interactive jora query workbench over your live server-side configuration. It replaces the old read-only Nuxt Options Viewer.
Its Nuxt Application source exposes three root fields:
nuxt— the resolved Nuxt options.nitro— the resolved Nitro options (populated once Nitro is created).vite— the resolved Viteclientandssrenvironment configs.
The source is live: every query reads the current state, so re-running a query after the Nitro/Vite hooks have completed reflects the latest values. Four read-only presets are provided — Overview (the whole object), Nuxt options, Nitro options, and Vite configs — each with function exclusion enabled so browsing configuration does not foreground methods. Your own custom queries are unrestricted and can invoke reachable functions or getters.
The panel's bundled UI includes an optional polling toggle (5s default, clamped 1–3600s) that pauses in background tabs.
Module authors who want to expose their own data can install @devframes/plugin-data-inspector and register sources through its registerDataSource API; they appear in the same inspector without any Nuxt-specific wrapper.
getServerData DevTools RPC that backed the old viewer is deprecated (NDT_DEP_0009). It still works as a compatibility shim but will be removed; use the Data Inspector panel instead.Code Server
The Code Server member in the Nuxt group embeds Coder's code-server. It is enabled by default: Nuxt DevTools detects the local code-server binary during setup, but starts no process until you choose Launch editor. If the binary is missing, the member shows installation instructions instead.
When launched, Code Server opens the Nuxt root directory by default, hands the generated authenticated session to the iframe, and streams process output to the built-in Terminals member. The process is also stopped when Nuxt closes.
export default defineNuxtConfig({
  devtools: {
    codeServer: {
      enabled: true,
      // All fields below are optional.
      bin: '/usr/local/bin/code-server',
      cwd: '/workspace/my-app',
      serverPort: 8080,
      host: '127.0.0.1',
      args: ['--disable-file-downloads'],
      env: { LOG_LEVEL: 'info' },
      cookieSuffix: 'my-app',
      startTimeout: 30_000,
    },
  },
})
The curated options are enabled, bin, cwd, serverPort, host, args, env, cookieSuffix, and startTimeout. When omitted, the upstream plugin defaults apply: the code-server binary, loopback host, a free port near Code Server's port 8080, and a 30-second startup timeout. Nuxt changes only the default cwd, setting it to the Nuxt root. Set codeServer.enabled: false to omit the member.
Nuxt DevTools owns authentication, so args cannot override --auth, --bind-addr, or --cookie-suffix, and env cannot set PASSWORD or HASHED_PASSWORD. Configure the bind host and cookie suffix through their dedicated fields.
The editor iframe connects directly to the Code Server port; Nuxt does not proxy it through app.baseURL. The browser must be able to reach that host and port, and an HTTPS page cannot embed an HTTP-only editor because of browser mixed-content rules. Binding to a non-loopback interface also exposes the port to that network, so apply the usual network controls.
This integration uses the experimental upstream @devframes/plugin-code-server. HTTPS, reverse proxies, containers, and remote port forwarding are governed by that plugin and your environment; Nuxt does not extend them or provide the removed Microsoft/tunnel/reuse modes.
Hooks
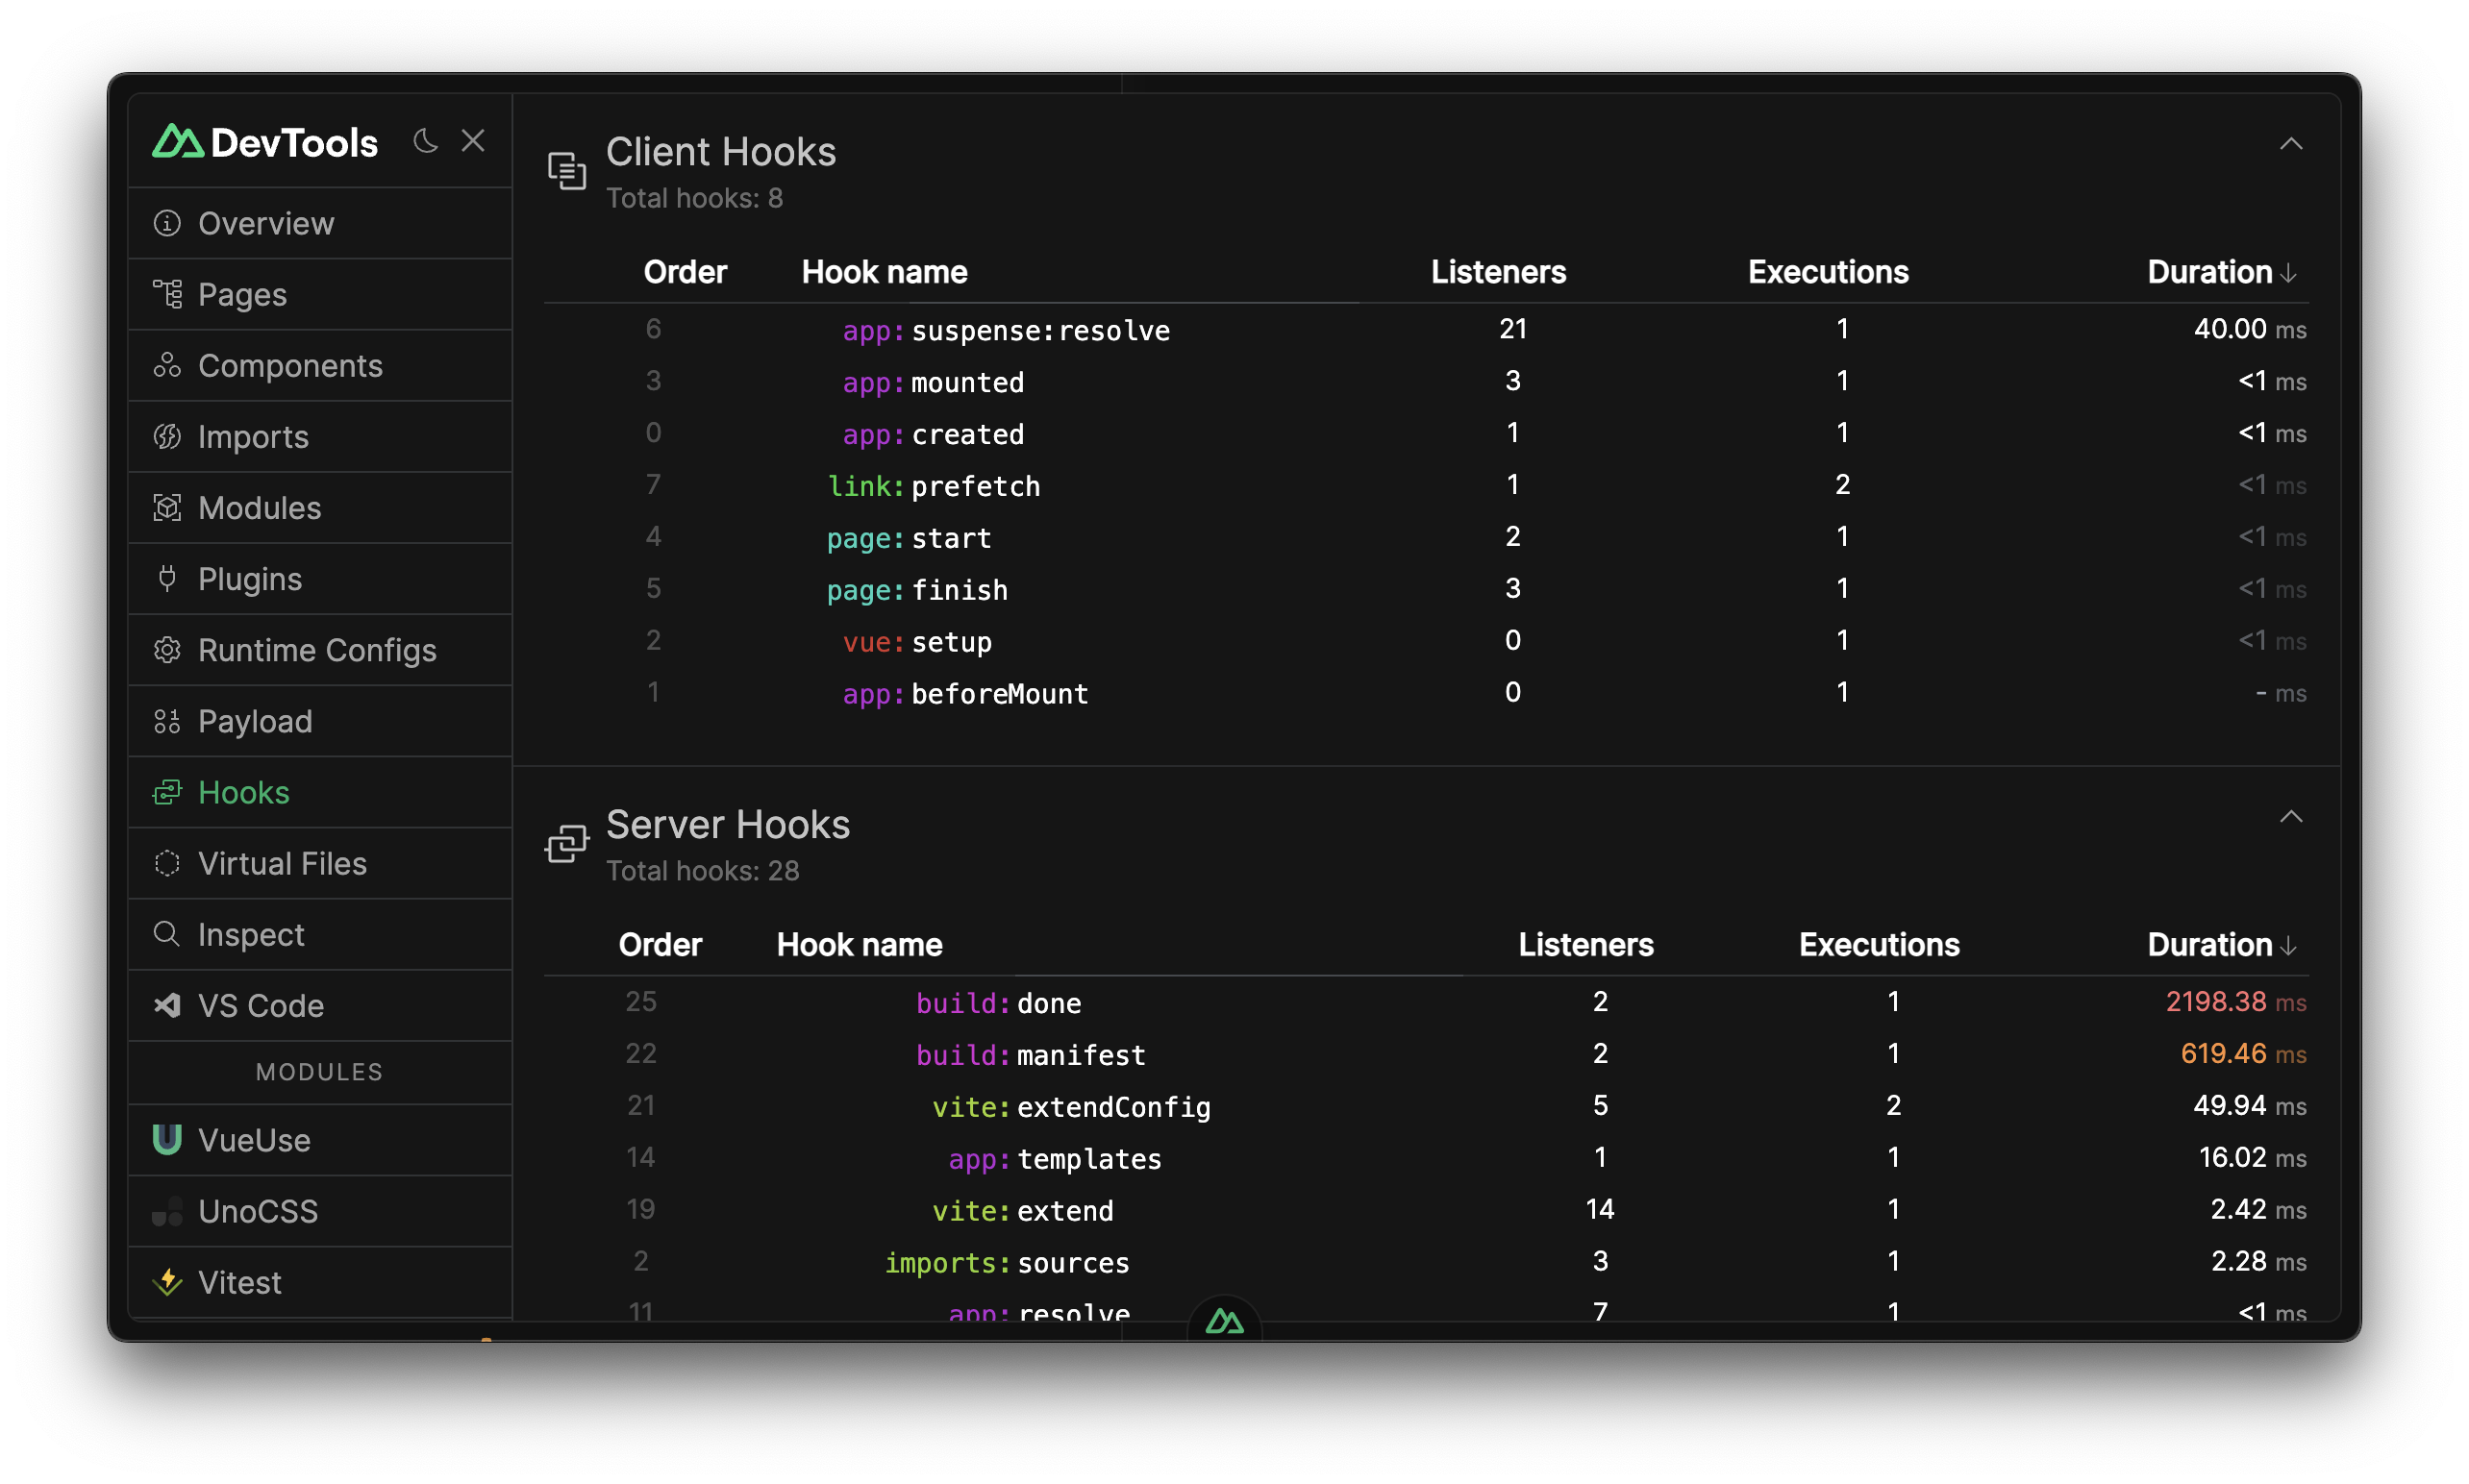
Hooks tab can help you to monitor the time spent in each hook. It can be helpful to find performance bottlenecks.
Virtual Files
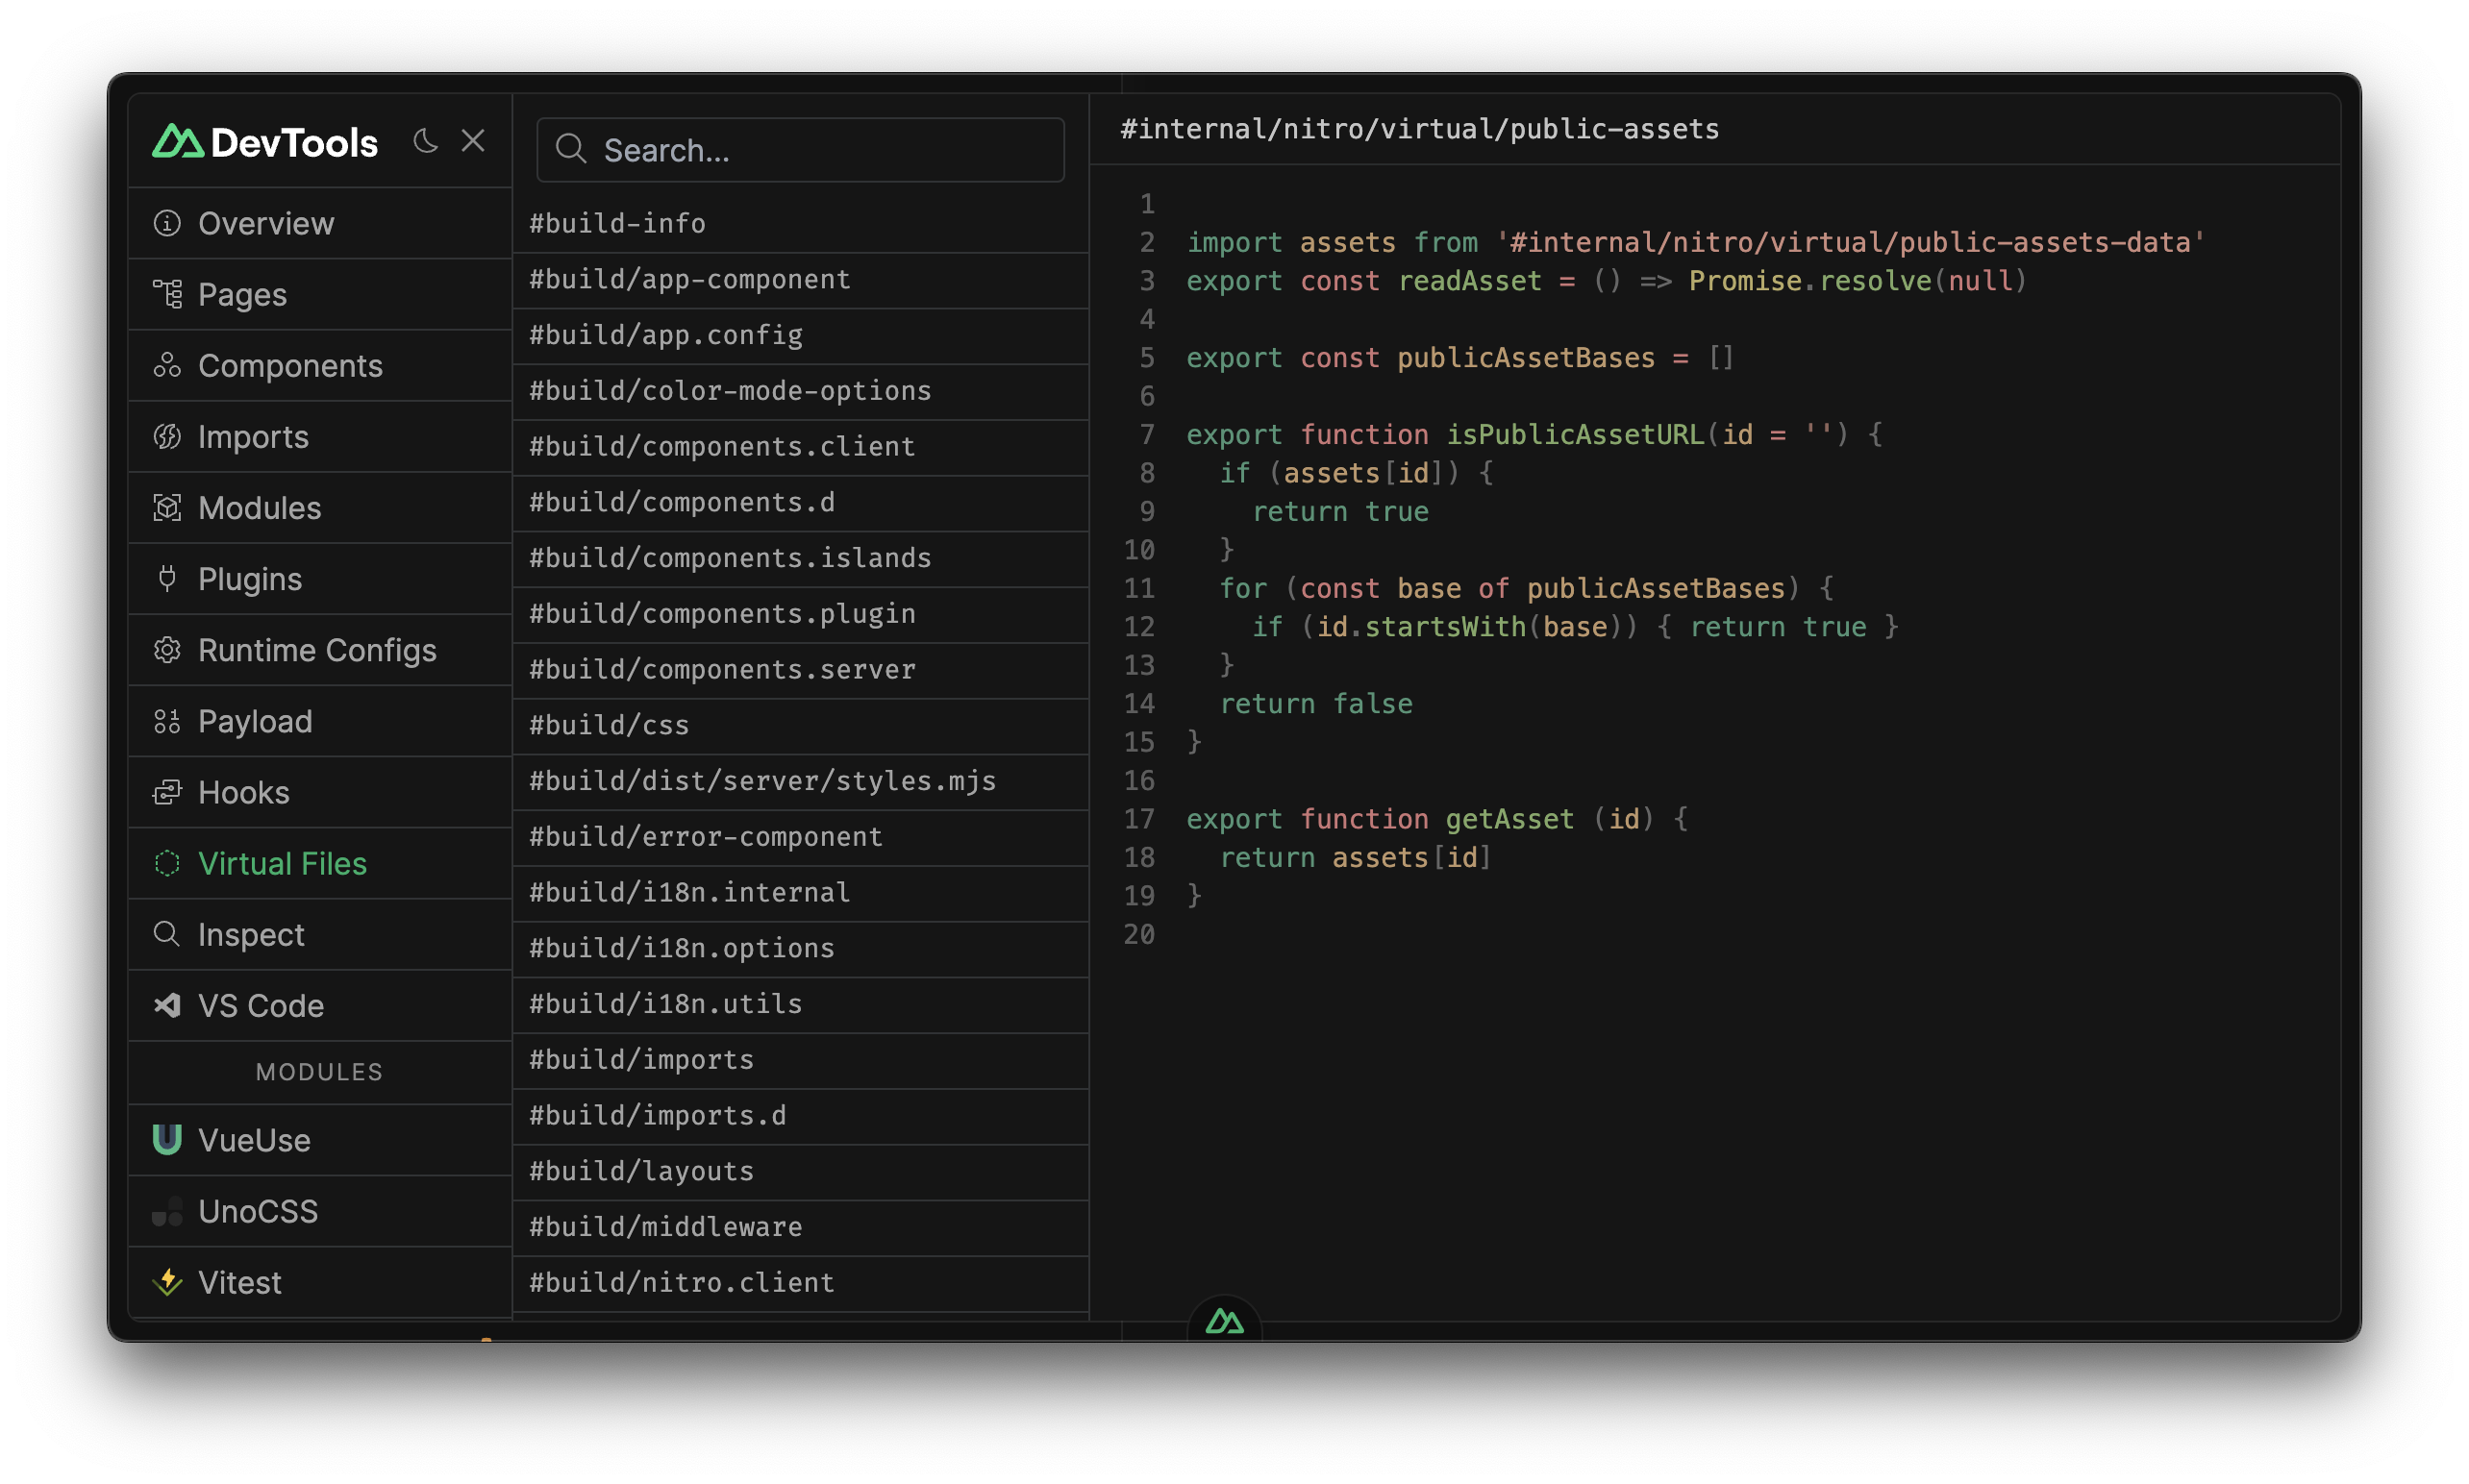
Virtual Files tab shows the virtual files generated by Nuxt to support the conventions.
Inspect
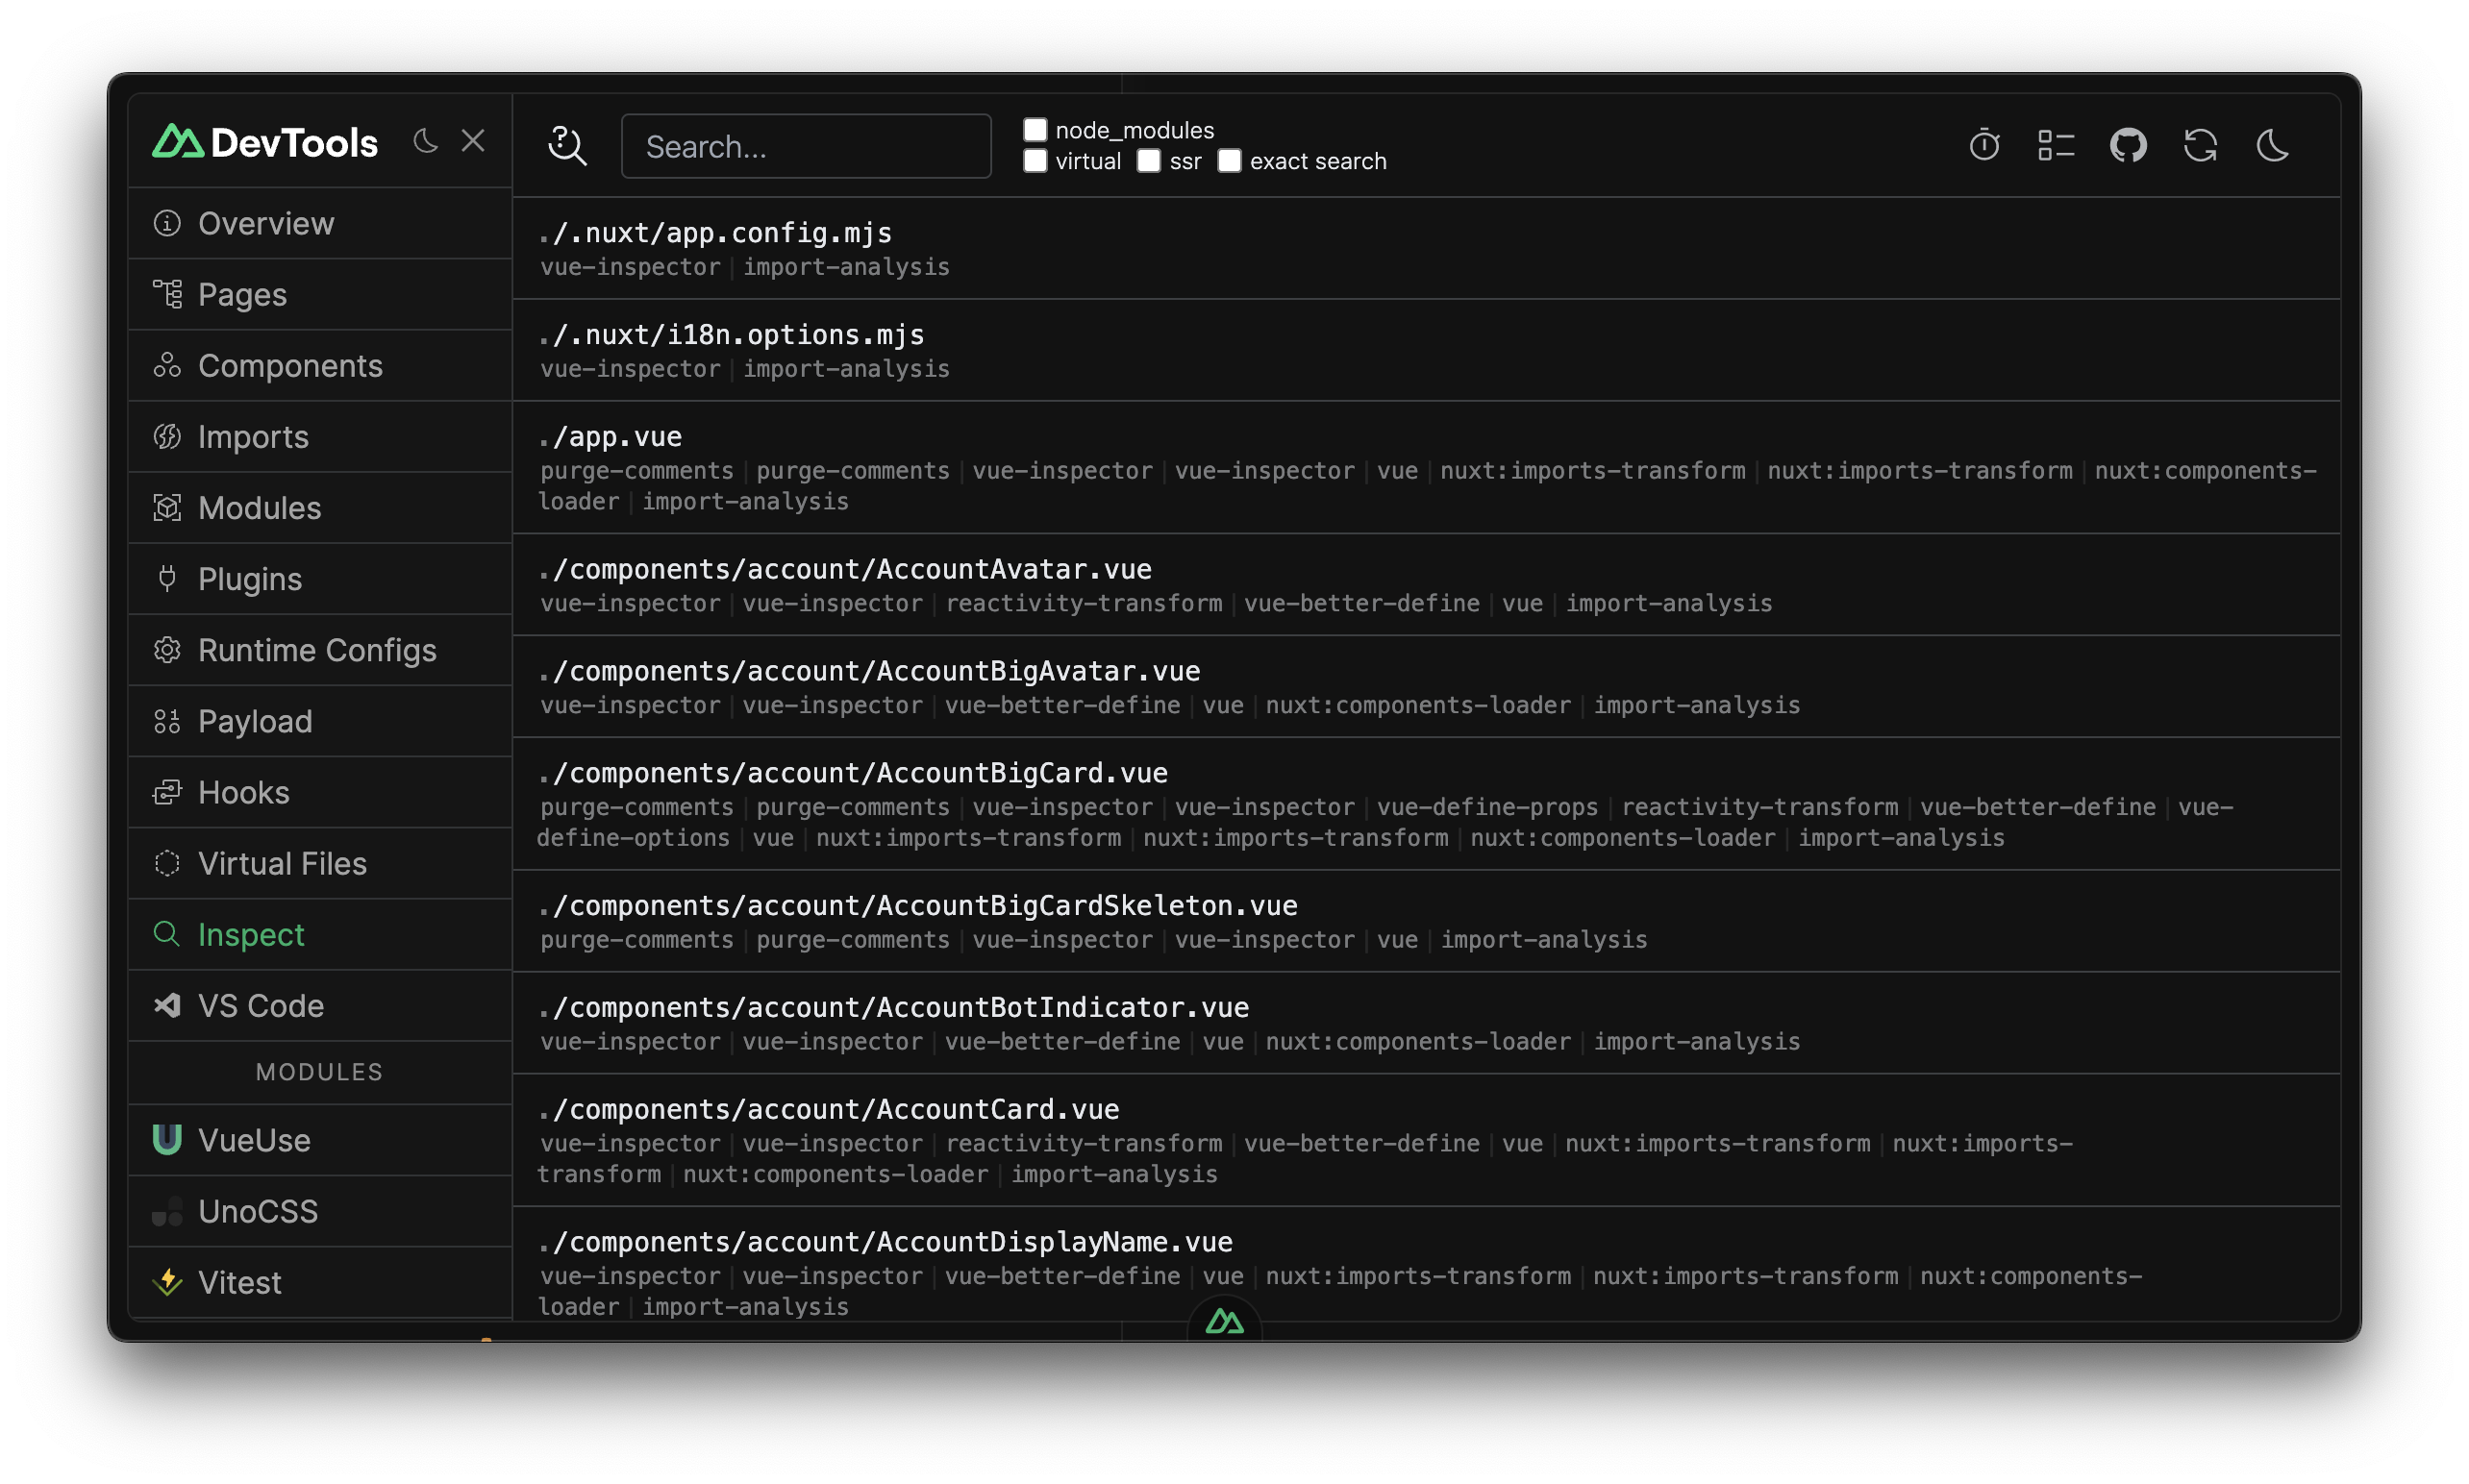
Inspect expose the vite-plugin-inspect integration, allowing you to inspect transformation steps of Vite.
vite-plugin-inspect is an optional peer dependency, so it is not installed by default. Until you add it to your project, DevTools shows an install launcher in the Inspect slot (the same experience as Vite Plus DevTools) — click it to install the plugin and restart the dev server to activate the view.
Settings
Settings tab allows you to configure the DevTools to your needs. you can hide tabs, change tabs order, scale, theme and more...